Fig. E.4
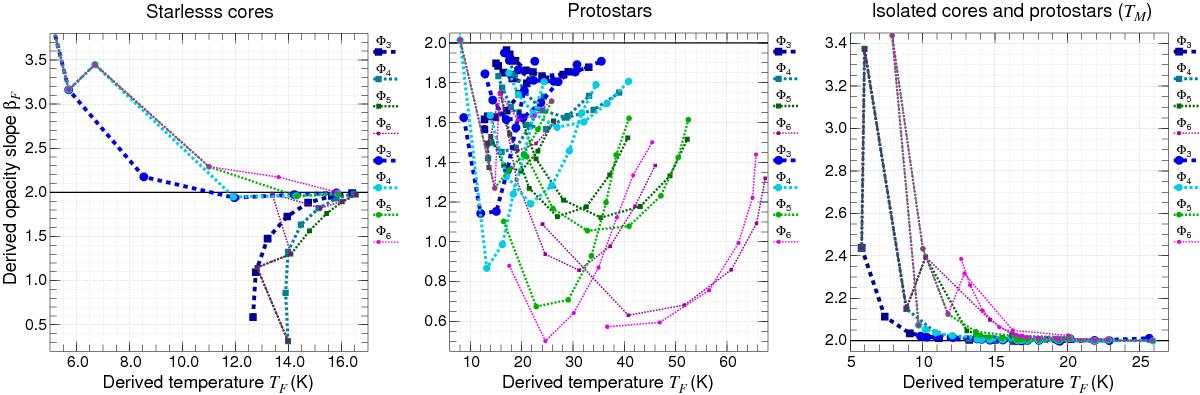
Relationships between TF and βF derived from fitting fluxes Fν of starless cores and protostellar envelopes (fits with free variable β). Curves plotted with squares (dark colors) and circles (bright colors) in the left and middle panels correspond to the isolated and embedded models, whereas in the right panel they correspond to the isothermal versions of the isolated starless cores and protostellar envelopes, respectively. Results for the starless cores are plotted for all masses 0.03−30 M⊙. Results for the protostellar envelopes, shown for only selected masses (0.03,0.3, and 3 M⊙, three sets of identical lines), span the entire range of luminosities 0.03−30 L⊙. Thick horizontal lines indicate the true value β = 2. For clarity of the plots, error bars are not shown.

Current usage metrics show cumulative count of Article Views (full-text article views including HTML views, PDF and ePub downloads, according to the available data) and Abstracts Views on Vision4Press platform.
Data correspond to usage on the plateform after 2015. The current usage metrics is available 48-96 hours after online publication and is updated daily on week days.
Initial download of the metrics may take a while.