Fig. D.1
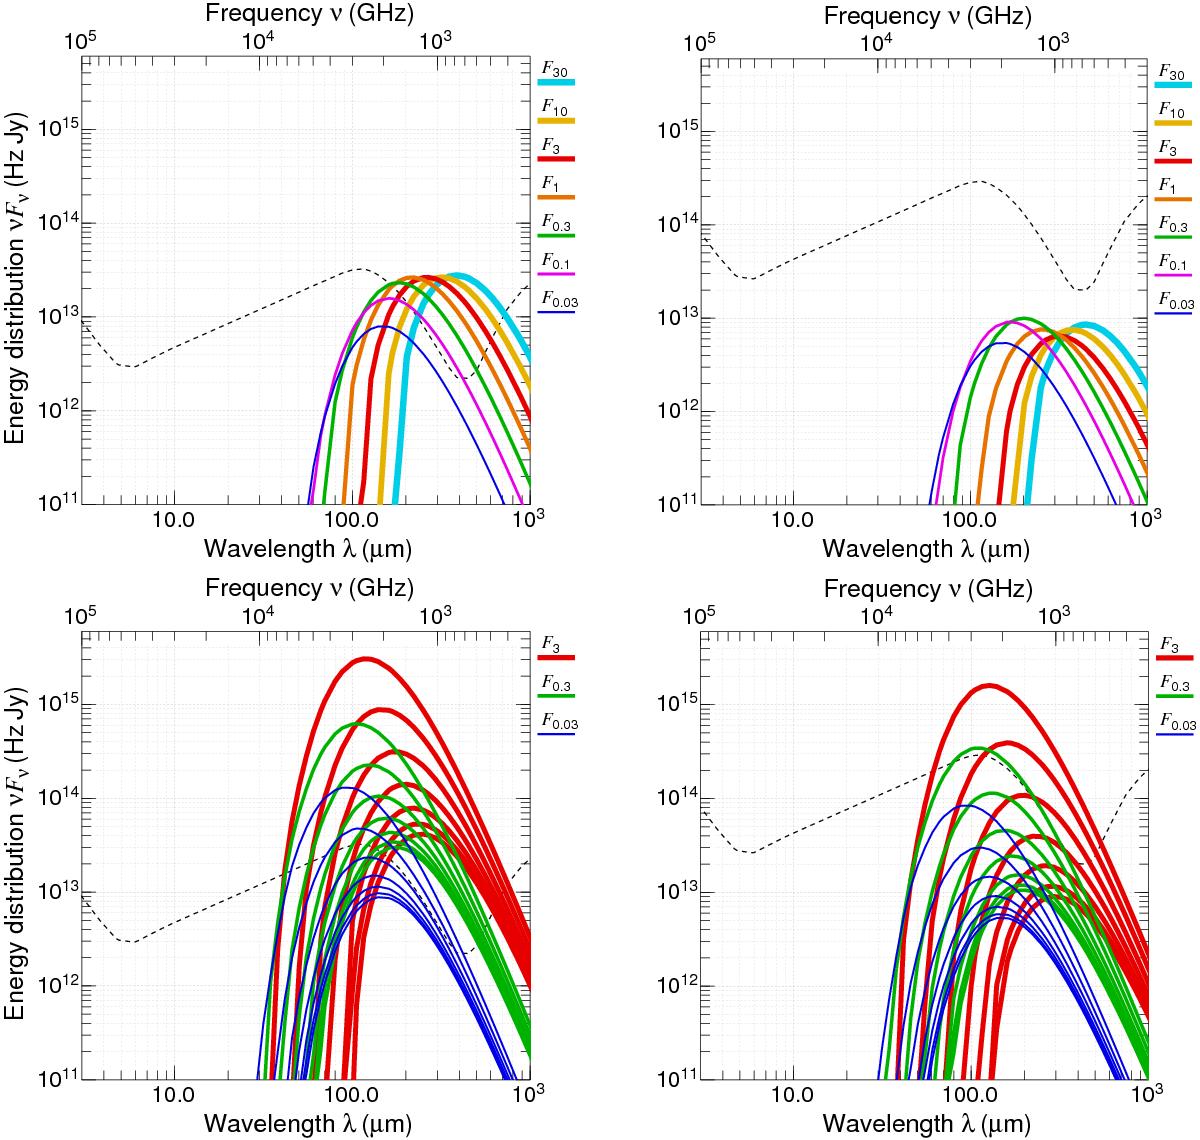
Spectral energy distributions of the isothermal models of starless cores (upper) and protostellar envelopes (lower). Shown are the background-subtracted fluxes of the isolated models (left) and of their embedded variants (right). For the cores of increasing masses, TM = {16.3, 15.0, 13.2, 11.2, 9.25, 7.66, 6.42 K}. For the envelopes of increasing luminosities and masses, TM = {16.6, 16.8, 17.3, 18.1, 19.5, 21.9, 25.9 K}, TM = {13.8, 14.1, 14.7, 15.6, 17.1, 19.4, 23.0 K}, TM = {10.0, 10.4, 11.1, 12.3, 14.1, 16.8, 20.7 K}. See Fig. 4 for more details.
Current usage metrics show cumulative count of Article Views (full-text article views including HTML views, PDF and ePub downloads, according to the available data) and Abstracts Views on Vision4Press platform.
Data correspond to usage on the plateform after 2015. The current usage metrics is available 48-96 hours after online publication and is updated daily on week days.
Initial download of the metrics may take a while.