Fig. 2
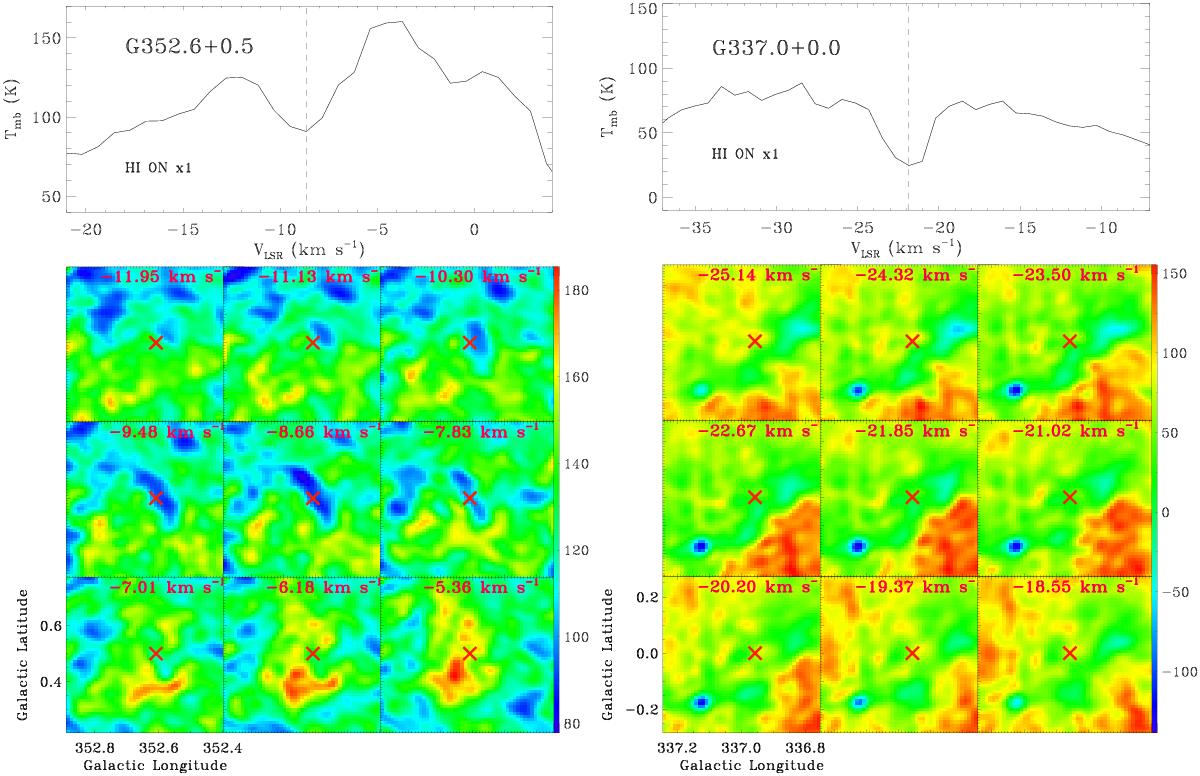
Hi spectrum and Hi channel map around absorption velocity toward G352.6+0.5 and G337.0+0.0, respectively. The dashed line on top of two Hi spectra profiles represents the central velocity of the absorption line. Red crosses below two channel maps represent positions toward G352.6+0.5 or G337.0+0.0. HINSA with real Hi absorption of foreground cold Hi cloud around ~−8.7 km s-1 is clearly seen toward G352.6+0.5. Non-HINSA with pseudo-absorption caused by relatively high brightness temperatures in neighbor velocity channels around ~−21.9 km s-1 is shown toward G337.0+0.0.
Current usage metrics show cumulative count of Article Views (full-text article views including HTML views, PDF and ePub downloads, according to the available data) and Abstracts Views on Vision4Press platform.
Data correspond to usage on the plateform after 2015. The current usage metrics is available 48-96 hours after online publication and is updated daily on week days.
Initial download of the metrics may take a while.