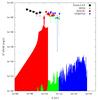
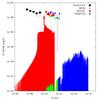
Fig. 9
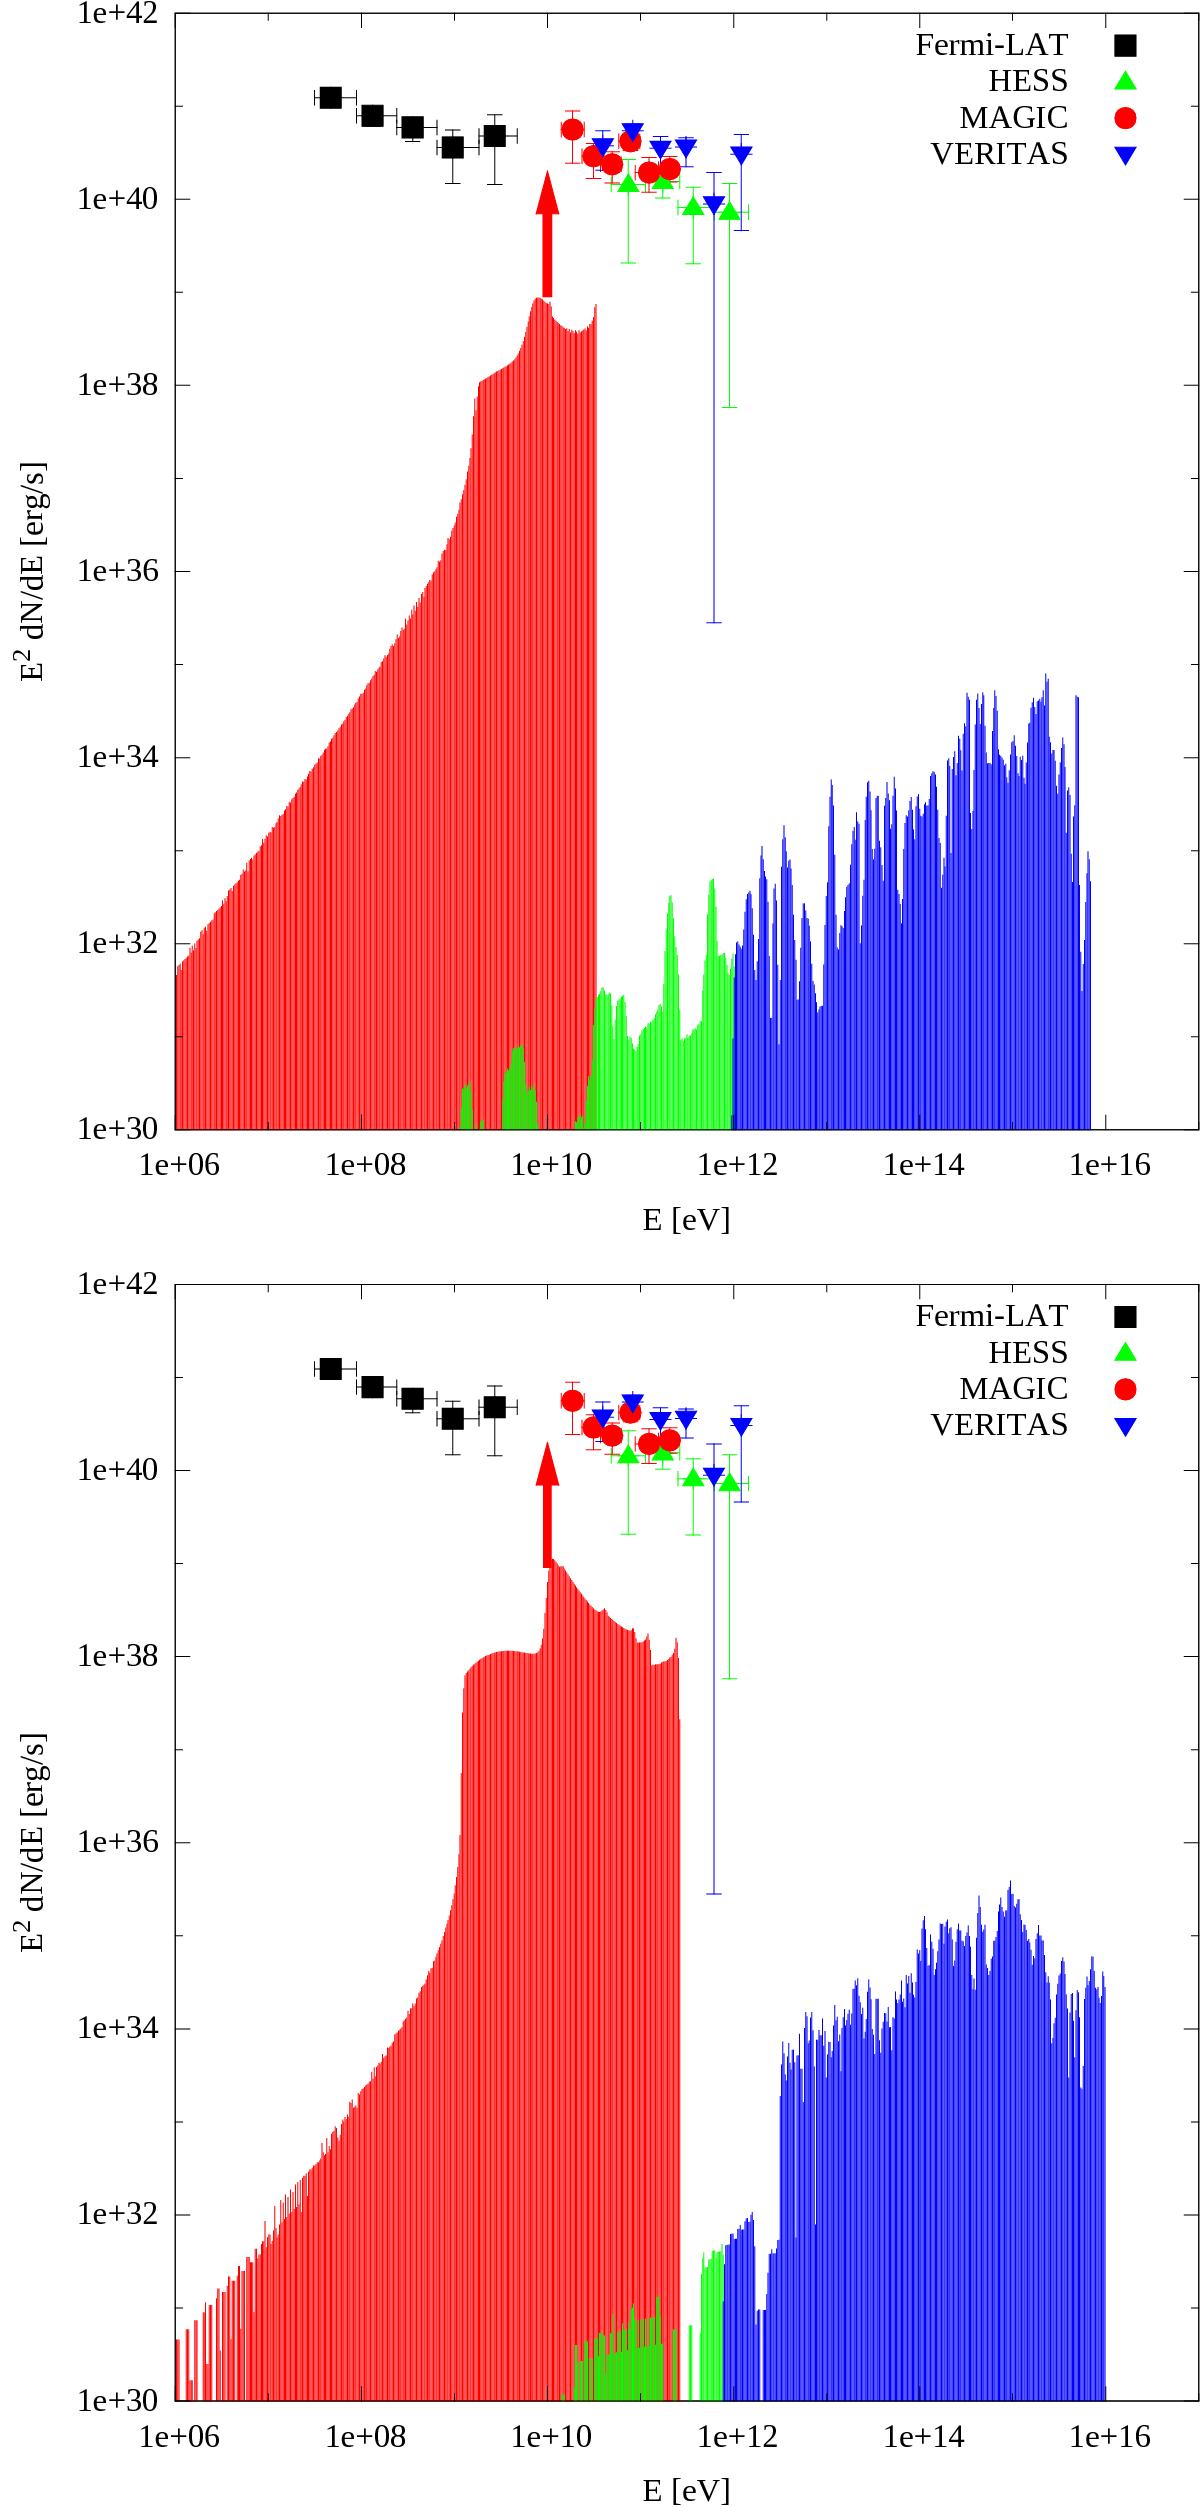
Spectra of emission from electrons in the gap in the split monopole magnetosphere in a low-luminosity RIAF with L = 8 × 1040 erg/s around a black hole of the mass M = 3 × 10⁹M⊙ and magnetic field B = 103 G (top) and B = 104 G (bottom). Red shows the synchrotron/curvature emission, blue and green show the inverse Compton emission, green corresponds to the photons that escape from the source, and blue shows the photons absorbed via pair production. A red arrow shows the normalisation uncertainty.
Current usage metrics show cumulative count of Article Views (full-text article views including HTML views, PDF and ePub downloads, according to the available data) and Abstracts Views on Vision4Press platform.
Data correspond to usage on the plateform after 2015. The current usage metrics is available 48-96 hours after online publication and is updated daily on week days.
Initial download of the metrics may take a while.