Fig. A.1
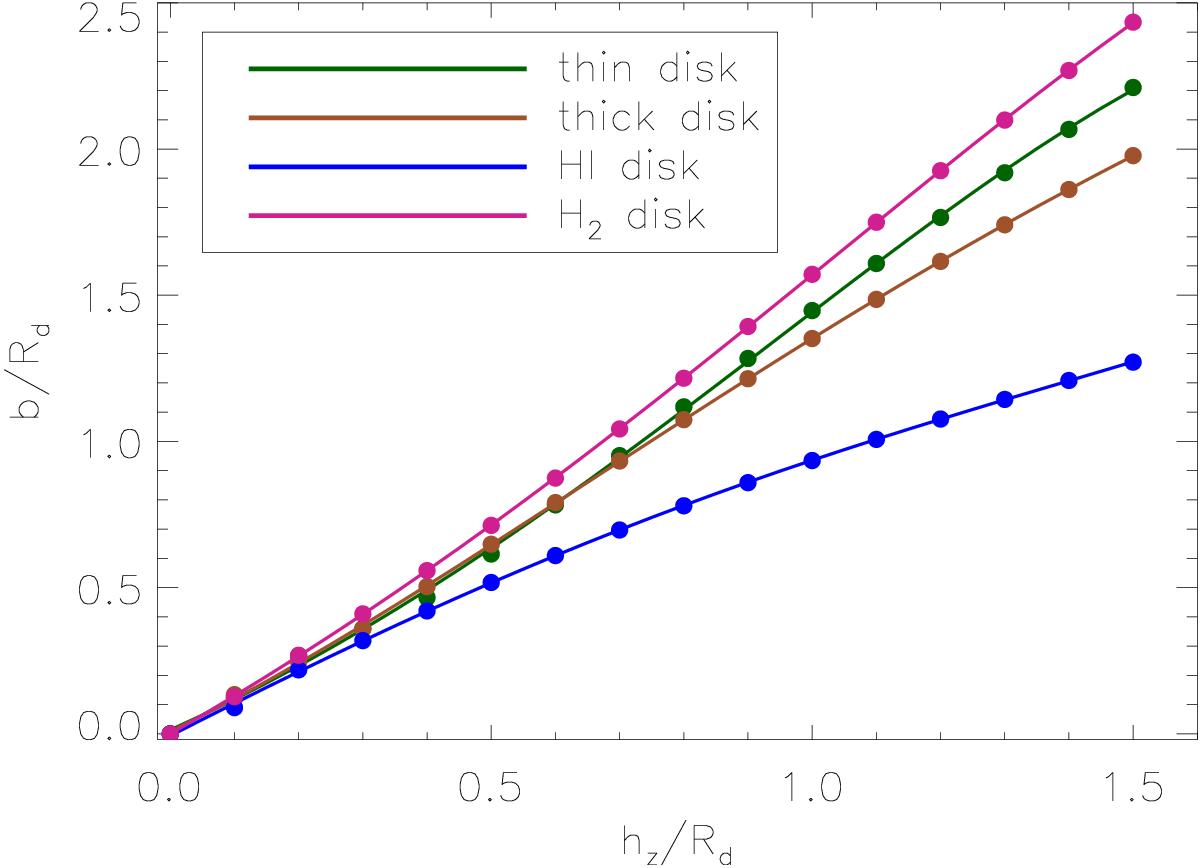
Variation of the thickness ratio b/Rd as a function of the ratio hz/Rd, for the thin and thick stellar disks and the H I and H2 disks subcomponents. Filled circles represent the optimal solutions found after the application of the cross-entropy algorithm, as described in Sect. 2.2.2 of the main text. Solid lines represent 4th-order polynomial fits to the distribution of points associated with each calculated relation.
Current usage metrics show cumulative count of Article Views (full-text article views including HTML views, PDF and ePub downloads, according to the available data) and Abstracts Views on Vision4Press platform.
Data correspond to usage on the plateform after 2015. The current usage metrics is available 48-96 hours after online publication and is updated daily on week days.
Initial download of the metrics may take a while.