Fig. 8
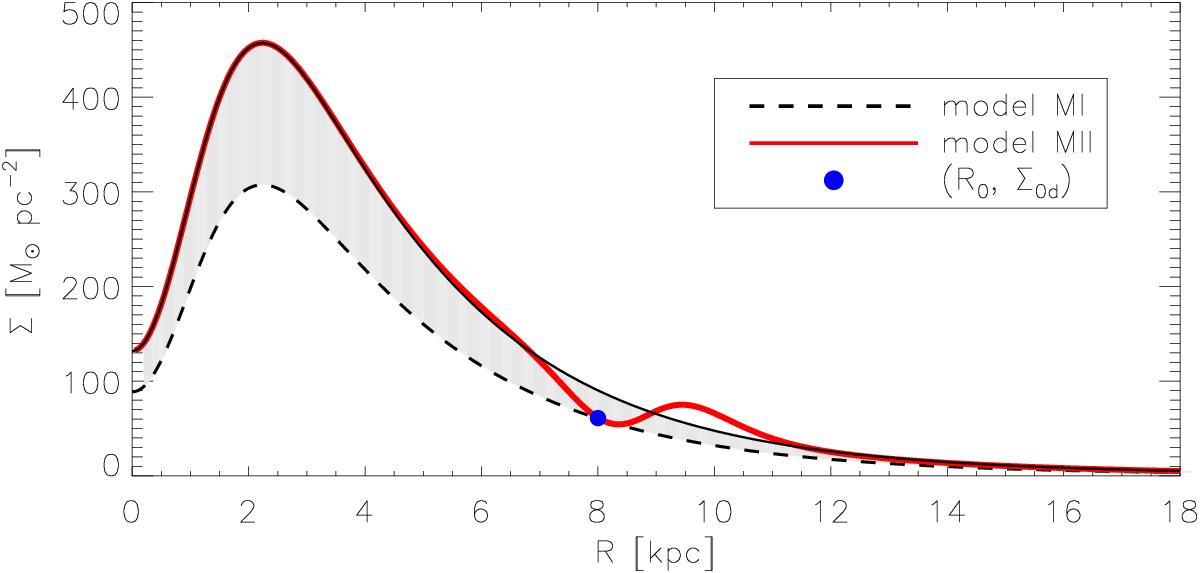
Surface density radial profile for the disks of model MI (dashed curve) and model MII (red solid curve). The black solid curve represents a disk with mass equivalent to that from model MII but without the ring density structure. The shaded area in light grey emphasizes the resulting difference in mass between the disks from both models. The blue point denotes the pair (R0; Σ0d).
Current usage metrics show cumulative count of Article Views (full-text article views including HTML views, PDF and ePub downloads, according to the available data) and Abstracts Views on Vision4Press platform.
Data correspond to usage on the plateform after 2015. The current usage metrics is available 48-96 hours after online publication and is updated daily on week days.
Initial download of the metrics may take a while.