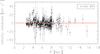
Fig. 5
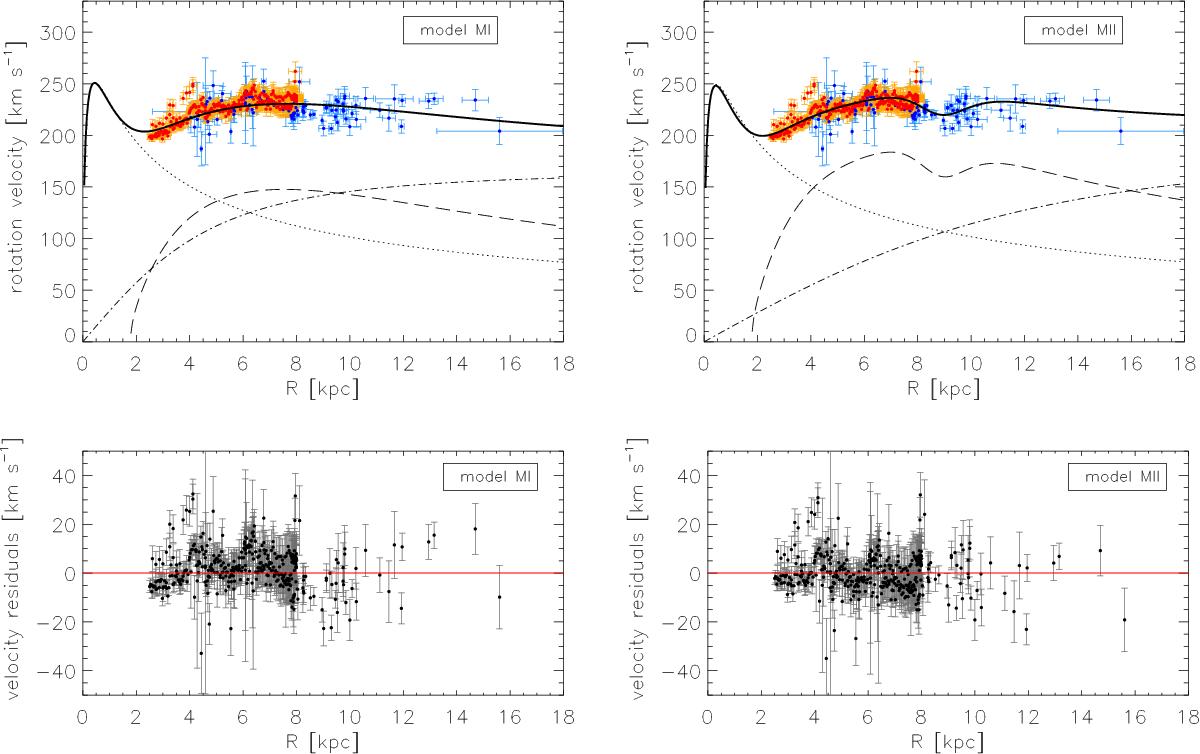
Left-hand column, top panel: rotation curve resulting from the Galactic model MI. The circular velocities due to the three mass components are depicted as dotted lines for the bulge, dashed lines for the disk, and dash-dotted lines for the dark halo. The total circular velocity is represented by the solid curve. The data for the observed rotation curve are presented as red points with orange error bars for the CO tangent-point data (Clemens 1985) and the H I tangent-point data (Fich et al. 1989); and blue points with light blue error bars for the maser sources data (Reid et al. 2014). Bottom panel: velocity residuals between the observed rotation velocities and the total circular model velocities calculated at each radius of the data points. Right-hand column: as for the left-hand column but for the Galactic model MII.
Current usage metrics show cumulative count of Article Views (full-text article views including HTML views, PDF and ePub downloads, according to the available data) and Abstracts Views on Vision4Press platform.
Data correspond to usage on the plateform after 2015. The current usage metrics is available 48-96 hours after online publication and is updated daily on week days.
Initial download of the metrics may take a while.