Fig. 2
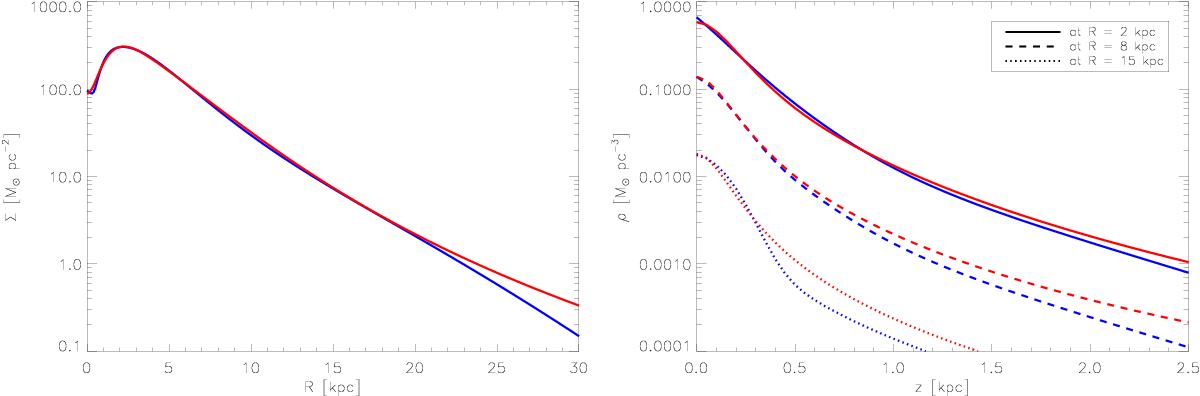
Left-hand panel: radial distribution of the surface mass density of the Galactic disk model; the “observation-based” disk model (blue curve) and the resultant from the sum of all the 3 MN-disk combinations fitted to each disk subcomponent (red curve). Right-hand panel: vertical profile of the volume density of the Galactic disk model as a function of the height z from the mid-plane and at three different arbitrary radii: R = 2 kpc (solid lines); R = 8 kpc (R0) (dashed lines); and R = 15 kpc (dotted lines). The blue curves are also related to the “observation-based” disk model and the red curves to the total 3 MN-disk combinations.
Current usage metrics show cumulative count of Article Views (full-text article views including HTML views, PDF and ePub downloads, according to the available data) and Abstracts Views on Vision4Press platform.
Data correspond to usage on the plateform after 2015. The current usage metrics is available 48-96 hours after online publication and is updated daily on week days.
Initial download of the metrics may take a while.