Fig. A.2
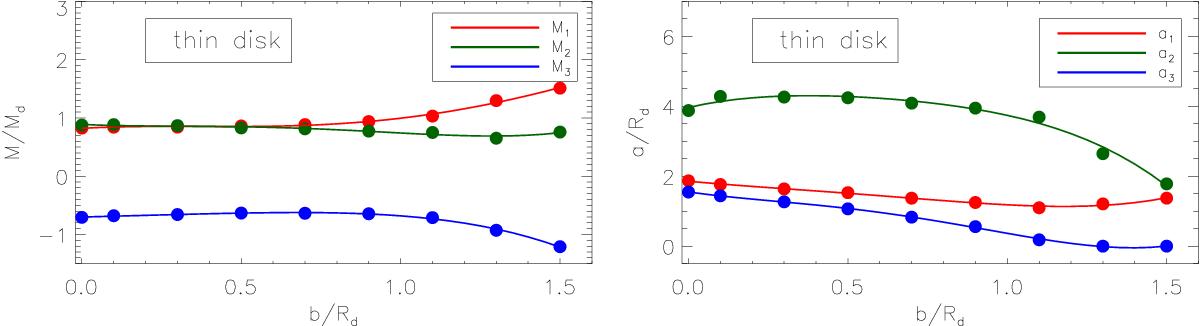
Left-hand panel: variation of the three mass parameters of the three MN-disk models as a function of the disk thickness ratio b/Rd, for the modelling of the thin stellar disk. Right-hand panel: variation of the three scale-length parameters as a function of the ratio b/Rd. In the panels, the points represent the optimal solutions found after the application of the cross-entropy algorithm. Solid lines are fourth-order polynomial fits to the distribution of points.
Current usage metrics show cumulative count of Article Views (full-text article views including HTML views, PDF and ePub downloads, according to the available data) and Abstracts Views on Vision4Press platform.
Data correspond to usage on the plateform after 2015. The current usage metrics is available 48-96 hours after online publication and is updated daily on week days.
Initial download of the metrics may take a while.