Fig. 2
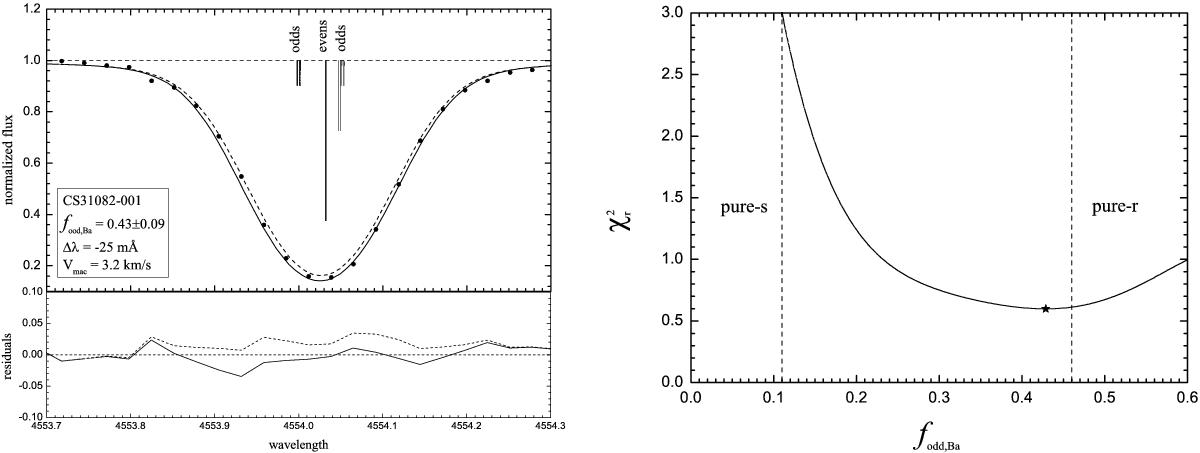
Left panel: best statistical fit synthetic profile obtained with fodd,Ba = 0.43 and NLTE line shapes for the observed (filled circles) Ba II resonance line at 4554 Å in CS 31082-001 with the residual plots below. For comparison, a line with fodd,Ba = 0.16 (i.e. 0.43−3σ) and residual have been plotted (dash-dot line). The value for Vmac has been optimized to one that minimizes ![]() , and the value for [Ba/Fe] remains the same. Right panel:
, and the value for [Ba/Fe] remains the same. Right panel: ![]() fit for the 4554 Å line, the star shows where the minimum of the fit lies.
fit for the 4554 Å line, the star shows where the minimum of the fit lies.
Current usage metrics show cumulative count of Article Views (full-text article views including HTML views, PDF and ePub downloads, according to the available data) and Abstracts Views on Vision4Press platform.
Data correspond to usage on the plateform after 2015. The current usage metrics is available 48-96 hours after online publication and is updated daily on week days.
Initial download of the metrics may take a while.