| Issue |
A&A
Volume 592, August 2016
|
|
|---|---|---|
| Article Number | L12 | |
| Number of page(s) | 4 | |
| Section | Letters | |
| DOI | https://doi.org/10.1051/0004-6361/201629208 | |
| Published online | 12 August 2016 | |
Study of a new central compact object: The neutron star in the supernova remnant G15.9+0.2
Institut für Astronomie und Astrophysik (IAAT),
Universität Tübingen, Sand
1, 72076 Tübingen, Germany
e-mail: This email address is being protected from spambots. You need JavaScript enabled to view it.
Received:
29
June
2016
Accepted:
17
July
2016
Abstract
We present our study of the central point source CXOU J181852.0−150213 in the young Galactic supernova remnant (SNR) G15.9+0.2 based on the recent ~90 ks Chandra observations. The point source was discovered in 2005 in shorter Chandra observations and was hypothesized to be a neutron star associated with the SNR. Our X-ray spectral analysis strongly supports the hypothesis of a thermally emitting neutron star associated with G15.9+0.2. We conclude that the object belongs to the class of young cooling low-magnetized neutron stars referred to as central compact objects (CCOs). We modeled the spectrum of the neutron star with a blackbody spectral function and with our hydrogen and carbon neutron star atmosphere models, assuming that the radiation is uniformly emitted by the entire stellar surface. Under this assumption, only the carbon atmosphere models yield a distance that is compatible with a source located in the Galaxy. In this respect, CXOU J181852.0−150213 is similar to two other well-studied CCOs, the neutron stars in Cas A and in HESS J1731−347, for which carbon atmosphere models were used to reconcile their emission with the known or estimated distances.
Key words: stars: neutron / ISM: supernova remnants / stars: atmospheres
© ESO, 2016
1. Introduction
Neutron stars are fundamental objects of modern astrophysics because (i) supranuclear densities in their interiors probably yield unexplored forms of matter; (ii) they are the outcome of the explosive collapse of massive stars; and (iii) their extreme gravitational and magnetic fields give rise to reach phenomenology of the associated emission and accretion. Only a few dozen neutron stars (NSs) are associated with their parent supernova remnants (SNRs). A dozen of these stars show pure thermal X-ray emission and lack any magnetic activity such as flaring, nonthermal magnetospheric emission or pulsar wind nebulae. This subgroup are usually referred to as central compact objects (CCOs) and were first considered as a separate class of isolated NSs by Pavlov et al. (2002, 2004) based on Chandra observations. For three CCOs, pulsations with periods in the range of ~0.1–0.4 s have been detected. The measured spin-down rates confirm relatively low magnetic fields of these objects, namely, B ~ 3 × 10¹⁰−1011 G (Halpern & Gotthelf 2010; Gotthelf et al. 2013), which is substantially weaker than in radio and accreting pulsars. The class of CCOs is thus believed to be composed by young (a few 103−104 yr), weakly magnetized, thermally emitting, cooling NSs.
One of the major efforts in NS studies is the modeling of the thermal emission from the stellar surface. Under certain assumptions, such a modeling permits constraints on the geometrical and physical properties of the stars and, most importantly, on their mass, radius, and effective temperature. Constraints on the mass and radius allow one to probe the equation of state of the superdense matter in the stellar interior (e.g., Haensel et al. 2007; Lattimer & Prakash 2016; Watts et al. 2016). The effective temperature of the stellar surface combined with the estimated age of the object allows one to probe the NS cooling rate (e.g., Page et al. 2004, 2006). The cooling mechanisms also strongly depend on the microphysics inside the star (e.g., Ofengeim et al. 2015; Beznogov & Yakovlev 2015). The relatively weak magnetic fields of CCOs permit modeling of their thermal emission under simplified assumptions, namely neglecting the effects of strong magnetic fields in the stellar atmosphere (e.g., Suleimanov et al. 2014, and references therein); this makes these objects perfect laboratories for the study of neutron star physics.
The point source CXOU J181852.0−150213 (hereafter, CXOU J1818) was serendipitously discovered in the Chandra X-ray observations of the radio-bright, few thousand year old SNR G15.9+0.2 (Reynolds et al. 2006). The relatively sparse data did not permit a detailed spectral analysis of the source. Reynolds et al. (2006) argued, however, that CXOU J1818 is probably a NS associated with the remnant. A rotation-powered pulsar or a CCO were considered by the authors to be viable possibilities. The object was subsequently listed among “CCO candidates” in Gotthelf et al. (2013). In this Letter, we present our analysis of the new Chandra observation of G15.9+0.2 and CXOU J1818, which has increased the total exposure time for these sources by a factor of four. Our study is focused on the compact source and is fully consistent with the CCO hypothesis. The detailed analysis of the diffuse emission of the SNR is not part of this work and will be presented elsewhere.
2. Observations and data analysis
The supernova remnant G15.9+0.2 was observed with the ACIS detector on board Chandra on June 30−31, 2015 for 93 ks (Obs. ID 16766). For the data processing and analysis, we used version 4.8 of Chandra Interactive Analysis of Observations software (CIAO; Fruscione et al. 2006) with the corresponding CALDB version 4.7.0. We applied the optional VFAINT correction for a more effective elimination of background events. A light curve extracted from a source-free region was used to check for possible background flares1; no flares were identified in our observations. Most of the remnant is covered by the back-illuminated S3 CCD-chip. Figure 1 shows a background-subtracted exposure-corrected image of G15.9+0.2 in the 0.5–7 keV range. We used the background from a set of blank-sky observations provided as a part of Chandra CALDB. The final image was smoothed with a local PSF at each point.
The point source CXOU J1818 is clearly visible in the ACIS image. For the spectral extraction, we used a circle with a radius of 1.2 arcsec encompassing ~90% of the source photon energy. In total, 307 photons are detected within the extraction radius. The background spectrum is extracted from an annulus around the source position with an inner and an outer radii of 2 and 10 arcsec, respectively. The exposure time of single frames was 3.14 s, which translates into ~0.01 source counts per frame in our observations. For such a count rate, the expected pile-up fraction is expected to be below one percent2.
We also reanalyzed the data of CXOU J1818 from the 2005 Chandra observations (~30 ks) presented by Reynolds et al. (2006). The obtained spectral parameters are found to be consistent with those presented by the authors as well as with those obtained with the new observations. Therefore, for our final results, we used simultaneous fits of the spectra extracted with the old and new observations.
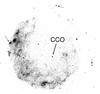 |
Fig. 1 Background-subtracted, exposure-corrected ACIS image of G15.9+0.2 in the 0.5–7 keV range extracted from our 2015 data. The central source CXOU J181852.0−150213 is indicated as “CCO”. The narrow arrows indicate the three foreground stars used to correct the coordinate system in the image. |
3. Absolute astrometry and timing
With the new observations, we attempted an improvement of the sky coordinates of CXOU J1818. The coordinates measured with the CIAO tool wavedetect in our observations have uncertainties of ~0.02 arcsec. The systematic uncertainty of the derived sky positions related to inaccuracy of the determined instrument pointing direction is expected to be 0.4 arcsec according to the instrument team3. We therefore performed a correction of the measured coordinates for a possible systematic offset. We identified three stars from the fourth U.S. Naval Observatory CCD Astrograph Catalog (UCAC4), which are visible in our Chandra image (indicated with thin arrows in Fig. 1). Our correction of the instrument pointing direction based on the optical sky positions of the stars resulted in a total shift of the coordinate system in the ACIS frame by 0.23 arcsec. The mean residual offset between the optical and X-ray positions of the three stars after the correction turns out to be 0.15 arcsec, which is within the statistical uncertainties of the measured X-ray coordinates of the stars. We thus conservatively ascribe a total uncertainty of 0.2 arcsec to the corrected sky coordinates of CXOU J1818 (J2000): α = 18h 18m 52.080s, δ = −15° 02′ 14.11′′.
We compared the updated coordinates of the CXOU J1818 with those of the two nearby stars from the Spitzer’s infrared GLIMPSE survey, G015.8781+00.1969 and G015.8774+00.1965, which are considered by Reynolds et al. (2006) as possible counterparts of the X-ray source. The angular separations with G015.8781+00.1969 and G015.8774+00.1965 are 2.1 and 0.8 arcsec, respectively. Comparing these separations with the uncertainty of 0.2 arcsec derived above we conclude, similarly to Reynolds et al. (2006), that the two stars are unlikely counterparts of CXOU J1818.
The low photon statistics (~300 source photons) does not permit a detailed timing analysis of the source. Nevertheless, we performed a search for pulsations down to the pulse period of ~6 s corresponding to the Nyquist frequency determined by the time resolution of the data (~3 s) using the Rayleigh periodogram ( -statistics; e.g., Protheroe 1987, and references therein). The derived 99% c.l. upper limit on the amplitude of sinusoidal pulsations turns out to be 0.56. Since the background is negligible, the derived upper limit essentially applies to the intrinsic pulsed fraction of the source.
4. Spectral modeling
The new observation of CXOU J1818 has a factor of three longer exposure time compared to the 2006 observations. The combined spectrum permits a detailed comparison between the spectral models of absorbed blackbody and absorbed power law. Such a comparison is crucial to establish the thermally emitting NS nature of the source. We rebinned the spectrum allowing a minimum of 20 photons per bin, which permits the usage of the Gaussian statistic (χ2) in the spectral modeling. The adopted number of counts per bin is, however, at the verge of the χ2 applicability. We have, therefore, redone all our spectral fits using the Poisson statistic (cstat in XSPEC, Cash 1979). The differences in the best-fit parameters between the two statistics are negligible compared to the statistical uncertainties of the parameters. All results of the spectral fits reported below are obtained with the χ2 statistic. To model the interstellar absorption at lower energies, we used the XSPEC wabs model with Wisconsin cross-sections (Morrison & McCammon 1983) and the Anders & Ebihara relative abundances (Anders & Ebihara 1982).
Both models, absorbed blackbody and absorbed power law, provide formally acceptable fits to the data, with  and 0.7, respectively, for 15 degrees of freedom (d.o.f.). The power-law model results, however, in a photon index of Γ ~ 6, which is substantially higher than the photon indices typical for the spectra of AGNs, young radio pulsars, and of pulsar wind nebulae. A blackbody fit on the other hand yields a temperature of kT ~ 0.5 keV (Fig. 2), which is typical for central neutron stars in SNRs (e.g., Pavlov et al. 2004). The absorbed flux in the 1−5 keV energy range (no photons are observed outside this range) is (3.6 ± 0.2) × 10-14 erg s-1 cm-2.
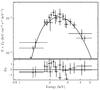 |
Fig. 2 Unfolded Chandra/ACIS spectra of the central point source CXOU J181852.0−150213 obtained in the 2005 and 2015 observations fitted with an absorbed blackbody model. |
Different spectral functions chosen to fit the data of CXOU J1818, namely power law versus blackbody, lead to different constraints on the absorption column density nH. This value can be compared with the nH value measured for the diffuse SNR emission, which has much better photon statistics compared to the point source. We modeled the entire SNR spectrum using the nonequilibrium ionization collisional plasma model vnei of XSPEC. We had to introduce an artificial nonzero redshift z ≃ 8 × 10⁻³, which apparently accounts for an uncalibrated gain drift of the ACIS energy scale4. As a result, an absorption column density of nH = (3.5 ± 0.1) × 1022 cm-2 is measured. We also extracted SNR spectra from a number of different regions of the remnant. The measured absorption varies in a range (3.2−4.4) × 1022 cm-2, whereas a value of (3.3 ± 0.1) × 1022 cm-2 is measured at the central region of the remnant surrounding CXOU J1818. A blackbody fit to the point source spectrum yields  cm-2 , which is fully consistent with the SNR values. The power-law fit to CXOU J1818, however, results in nH = (6.6 ± 0.7) × 1022 cm-2; this is significantly higher than the absorption of the diffuse emission. It is therefore unlikely that the central source has an intrinsic power-law spectrum. Its spectral properties are much more typical for a thermally emitting NS as in the case of CCOs.
5. Neutron star atmosphere models
The blackbody fit to the spectrum of CXOU J1818 leads to an unrealistic distance to the object, which is on the order of 200 kpc if we assume the radius of the emitting region to be equal to the canonical NS radius of 12 km. A realistic distance of ~10 kpc or below would require a radius of the emitting region below ~0.5 km. Such an apparent discrepancy between the radii of the emitting regions derived from a blackbody spectral model and, assuming the canonical radius of the NS, is known for CCOs; see, e.g., Table 2 in Pavlov et al. (2004). A solution to this problem is provided by calculations of the emergent spectrum using NS atmosphere models that are sometimes combined with the assumption of compact emitting “hot spots” on the stellar surface (Pavlov & Luna 2009; Ho & Heinke 2009; Klochkov et al. 2013; Bogdanov 2014). We applied the nonmagnetic hydrogen and carbon atmosphere models developed in our group for NSs (Suleimanov et al. 2014; Klochkov et al. 2015) to fit the extracted ACIS spectrum of CXOU J18185.
Results of the spectral modeling of CXOU J181852.0−150213 with a blackbody spectral function and with hydrogen and carbon atmosphere models.
In our model atmosphere fits, we assume that the object is a NS associated with the remnant. We, therefore, fixed the absorption column density to the value of 3.5 × 1022 cm-2 obtained for the diffuse emission of G15.9+0.2. The photon statistics in the spectrum are insufficient to obtain any meaningful constraints on the mass and radius of the star. Therefore, we fixed these parameters to the canonical values of M = 1.5 M⊙ and R = 12 km. The results of the fit with the atmosphere models and with a blackbody spectral function are summarized in Table 1. A known effect of applying the atmosphere models that can be recognized is a lower effective temperature compared to that obtained from the blackbody fit (e.g., Suleimanov et al. 2014). As a result, the distances derived from the normalization constant of the models are substantially reduced. For the carbon atmosphere model, it is consistent with the source being located in the Galaxy (Table 1).
However, the value of the absorption column density derived from the modeling of the SNR diffuse emission might be affected by additional systematic uncertainties related to the choice of the plasma emission model (we used the simplest single-temperature nonequilibrium plasma), an inaccurate background-subtraction, and to the inhomogeneity of the absorbing matter across the remnant. Therefore, in Table 1 we also quote the results of the model atmosphere fits leaving nH as a free fit parameter. The uncertainties of the spectral parameters, especially of the derived distances, which naturally increase in this case. Nevertheless, the mentioned conclusions of the model atmosphere fits are still valid; only the carbon atmosphere model yields a distance that is formally compatible with a Galactic SNR. The best-fit absorption column densities stay within the range measured over the remnant (see the previous section).
The distances derived from the model atmosphere fits scale with the assumed mass and radius of the NS, which are fixed to the canonical values in the fits above. In the case of the carbon atmosphere model and fixed nH, the scaling is such that the best-fit distance increases to ~30 kpc for M = 2 M⊙ and decreases to ~20 kpc for M = 1 M⊙. The scaling with the NS radius is such that the best-fit distance increases to ~30 kpc for R = 15 km and decreases to ~22 kpc for R = 10 km. For the hydrogen atmospheres, the scaling is in the same direction.
6. Conclusions
Our spectral analysis of the central source in the SNR G15.9+0.2 clearly supports the hypothesis of a thermally emitting NS. The object thus can be considered to be a new member of the CCO class. A power-law spectral model yields an absorption column density that is incompatible with that of the remnant and a photon index that is much softer than expected in case of an AGN, a young radio pulsar, or a pulsar wind nebula. We thus consider these alternatives as rather improbable. We also confirmed the absence of an optical or infrared counterpart with the improved sky coordinates of the source. The stellar coronal origin of the object is, therefore, also unlikely.
Similar to other CCOs, the distance to CXOU J1818 derived from the blackbody normalization is unrealistically high, ~200 kpc, assuming that the radiation is emitted by the entire stellar surface. A fit with the hydrogen atmosphere models reduces the distance to ~40–70 kpc, which is still too high for a Galactic source. Only the carbon atmosphere model yields a meaningful distance of ~10–20 kpc. Very similar results have been obtained for two other CCOs for which much better observational data are available (higher flux, longer and multiple observations), specifically, the central NSs in SNRs Cas A (Ho & Heinke 2009) and HESS J1731−347 (Klochkov et al. 2013, 2015). In these two objects, the hypothesis that the radiation is uniformly emitted by the entire stellar surface (i.e., that the emitting radius is equal to the stellar radius) is supported by the relatively stringent limits on the pulsed fraction of ≲10%. Our data do not permit any useful constraints on pulsations of CXOU J1818. The pulse periods of the known pulsations CCOs, RX J0822.0−4300, 1E 1207.4−5209, and CXOU J185238.6+004020, are all below ~0.4 s, which is in the range inaccessible with the Chandra observations due to insufficient timing resolution. Nevertheless, the similarities in the spectral properties of CXOU J1818 with the well-studied CCOs in Cas A and in HESS J1731−347 suggest a similar geometry
and physics of emission in the three NSs and further supports the association of CXOU J1818 with the class of CCOs.
The carbon atmosphere model for XSPEC is available at https://heasarc.gsfc.nasa.gov/xanadu/xspec/models/carbatm.html
Acknowledgments
We thank the anonymous referee for her/his comments and suggestions that substantially improved the manuscript. M.S. acknowledges support by the German Research Foundation through the Heisenberg grant SA 2131/3-1. V.S. acknowledges support by the German Research Foundation through the grant WE 1312/48-1.
References
- Anders, E., & Ebihara, M. 1982, Geochim. Cosmochim. Acta, 46, 2363 [NASA ADS] [CrossRef] [Google Scholar]
- Beznogov, M. V., & Yakovlev, D. G. 2015, MNRAS, 452, 540 [NASA ADS] [CrossRef] [Google Scholar]
- Bogdanov, S. 2014, ApJ, 790, 94 [NASA ADS] [CrossRef] [Google Scholar]
- Cash, W. 1979, ApJ, 228, 939 [NASA ADS] [CrossRef] [Google Scholar]
- Fruscione, A., McDowell, J. C., Allen, G. E., et al. 2006, in Proc. SPIE Conf. Ser., 6270, 62701V [Google Scholar]
- Gotthelf, E. V., Halpern, J. P., & Alford, J. 2013, ApJ, 765, 58 [NASA ADS] [CrossRef] [Google Scholar]
- Haensel, P., Potekhin, A. Y., & Yakovlev, D. G. 2007, Neutron Stars 1: Equation of State and Structure, Astrophys. Space Sci. Lib., 326 [Google Scholar]
- Halpern, J. P., & Gotthelf, E. V. 2010, ApJ, 709, 436 [NASA ADS] [CrossRef] [Google Scholar]
- Ho, W. C. G., & Heinke, C. O. 2009, Nature, 462, 71 [NASA ADS] [CrossRef] [PubMed] [Google Scholar]
- Klochkov, D., Pühlhofer, G., Suleimanov, V., et al. 2013, A&A, 556, A41 [NASA ADS] [CrossRef] [EDP Sciences] [Google Scholar]
- Klochkov, D., Suleimanov, V., Pühlhofer, G., et al. 2015, A&A, 573, A53 [NASA ADS] [CrossRef] [EDP Sciences] [Google Scholar]
- Lattimer, J. M., & Prakash, M. 2016, Phys. Rep., 621, 127 [NASA ADS] [CrossRef] [Google Scholar]
- Morrison, R., & McCammon, D. 1983, ApJ, 270, 119 [NASA ADS] [CrossRef] [Google Scholar]
- Ofengeim, D. D., Kaminker, A. D., Klochkov, D., Suleimanov, V., & Yakovlev, D. G. 2015, MNRAS, 454, 2668 [NASA ADS] [CrossRef] [Google Scholar]
- Page, D., Geppert, U., & Weber, F. 2006, Nucl. Phys. A, 777, 497 [NASA ADS] [CrossRef] [Google Scholar]
- Page, D., Lattimer, J. M., Prakash, M., & Steiner, A. W. 2004, ApJS, 155, 623 [NASA ADS] [CrossRef] [Google Scholar]
- Pavlov, G. G., & Luna, G. J. M. 2009, ApJ, 703, 910 [NASA ADS] [CrossRef] [Google Scholar]
- Pavlov, G. G., Sanwal, D., Garmire, G. P., & Zavlin, V. E. 2002, in Neutron Stars in Supernova Remnants, eds. P. O. Slane, & B. M. Gaensler, ASP Conf. Ser., 271, 247 [Google Scholar]
- Pavlov, G. G., Sanwal, D., & Teter, M. A. 2004, in Young Neutron Stars and Their Environments, eds. F. Camilo, & B. M. Gaensler, IAU Symp., 218, 239 [Google Scholar]
- Protheroe, R. J. 1987, PASA, 7, 167 [NASA ADS] [Google Scholar]
- Reynolds, S. P., Borkowski, K. J., Hwang, U., et al. 2006, ApJ, 652, L45 [NASA ADS] [CrossRef] [Google Scholar]
- Suleimanov, V. F., Klochkov, D., Pavlov, G. G., & Werner, K. 2014, ApJS, 210, 13 [Google Scholar]
- Watts, A. L., Andersson, N., Chakrabarty, D., et al. 2016, Rev. Mod. Phys., 88, 021001 [NASA ADS] [CrossRef] [Google Scholar]
All Tables
Results of the spectral modeling of CXOU J181852.0−150213 with a blackbody spectral function and with hydrogen and carbon atmosphere models.
All Figures
|
Fig. 1 Background-subtracted, exposure-corrected ACIS image of G15.9+0.2 in the 0.5–7 keV range extracted from our 2015 data. The central source CXOU J181852.0−150213 is indicated as “CCO”. The narrow arrows indicate the three foreground stars used to correct the coordinate system in the image. |
| In the text | |
|
Fig. 2 Unfolded Chandra/ACIS spectra of the central point source CXOU J181852.0−150213 obtained in the 2005 and 2015 observations fitted with an absorbed blackbody model. |
| In the text | |
Current usage metrics show cumulative count of Article Views (full-text article views including HTML views, PDF and ePub downloads, according to the available data) and Abstracts Views on Vision4Press platform.
Data correspond to usage on the plateform after 2015. The current usage metrics is available 48-96 hours after online publication and is updated daily on week days.
Initial download of the metrics may take a while.