| Issue |
A&A
Volume 592, August 2016
|
|
|---|---|---|
| Article Number | A155 | |
| Number of page(s) | 4 | |
| Section | Extragalactic astronomy | |
| DOI | https://doi.org/10.1051/0004-6361/201629062 | |
| Published online | 24 August 2016 | |
Research Note
Total infrared luminosity estimation from local galaxies in AKARI all sky survey
1 National Center for Nuclear Research,
ul. Hoża 69, 00-681 Warsaw, Poland
e-mail: This email address is being protected from spambots. You need JavaScript enabled to view it.
2 Division of Particle and
Astrophysical Science, Nagoya University, Furo-cho, Chikusa-ku, 464-8602
Nagoya,
Japan
3 The Astronomical Observatory of the
Jagiellonian University, ul. Orla
171, 30-244
Kraków,
Poland
Received:
6
June
2016
Accepted:
20
July
2016
Abstract
We aim to use the a new and improved version of AKARI all sky survey catalogue of far-infrared sources to recalibrate the formula to derive the total infrared luminosity. We cross-match the faint source catalogue (FSC) of IRAS with the new AKARI-FIS and obtained a sample of 2430 objects. Then we calculate the total infrared (TIR) luminosity LTIR from the formula previously estimated from IRAS data and compare it with total infrared luminosity from AKARI FIS bands to obtain new coefficients for the general relation to convert FIR luminosity from AKARI bands to the TIR luminosity.
Key words: infrared: galaxies / galaxies: star formation / galaxies: evolution
© ESO, 2016
1. Introduction
The question of how and when galaxies have formed their stellar content is paramount when addressing the topic of formation and evolution of galaxies. The baryonic gas contained within a dark matter halo goes through a cooling process, which results in a decrease of pressure. As a result, it starts to flow into the centre of the halos’ potential well, creating an excess of density. When it exceeds the density of the dark matter, the gas starts to act under its own gravity and eventually collapses. This process ultimately leads to the creation of a dense cloud of molecular gas, which will serve as a “nursery” for the star formation (e.g. Williams et al. 2000).
The process of formation of stars in galaxies is always accompanied by the dust production (e.g. Schulz 2005; Stahler & Palla 2004); however, the exact physics of this process is still a subject of investigation (e.g. Takeuchi et al. 2005b). One thing is certain, though: the dust particles in galaxies absorb the ultra-violet (UV) radiation emitted by young, hot stars, and re-emit it in the far infrared (FIR). Therefore, the observations at these wavelengths are in tight correlation with the amount of the dust contained in a galaxy and with its stellar content properties. Majority of the star forming regions within a galaxy are hidden in dense gas clouds (e.g. Buat et al. 2007), which makes them impossible to observe in the UV. This fact is also confirmed by analyses of the evolution of the luminosity function (the dependence of the number of stars/galaxies on their absolute magnitude) both in FIR and UV (Takeuchi et al. 2005a), with the former one being far stronger than the latter, which means that the amount of the hidden star formation zones grows proportionally with redshift (for z< 1). All those reasons make the infrared observations of the Universe crucial for understanding the star formation history of the Universe.
One of the ways to quantify star-formation is to measure the total infrared luminosity (LTIR), as the two are tightly correlated (e.g. Helou et al. 1988; Sanders & Mirabel 1996; Dale et al. 2001; Dale & Helou 2002; Draine & Li 2007; Takeuchi et al. 2010). Therefore, by using the emission measured throughout different IR passbands it is possible to recover the information about the star-formation activity of galaxies.
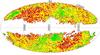 |
Fig. 1 Sky distribution of the AKARI FIS sources from the new catalogue with areas of high 100 μm emission removed. |
The purpose behind the launch of AKARI satellite was to make all-sky surveys at infrared wavelengths with better sensitivity, spatial resolution and wavelength coverage than that of its predecessor: pioneering IRAS (Soifer et al. 1987). Other past IR satellites, ISO (Kessler et al. 1996) and Spitzer Space Telescope (Werner et al. 2004), though having better capabilities than IRAS, were not designed for all-sky surveys. The AKARI satellite was launched by JAXA’s MV8 vehicle on February 22, 2006, and one of its main goals was to perform and all-sky survey at FIR wavelengths. For this purpose a dedicated FIS camera Kawada et al. (2007) was used. It covered the wavelength range between 50 and 180 μm through exposure of 4 FIR filters: N60 centred at 65 μm, WIDE-S centred at 90 μm, WIDE-L centred at 140 μm and N160 centred at 160 μm.
In this work, we use new and secure data from AKARI all sky survey to present a recalibrated formula to recover LTIR. We adopt a cosmological model with Ωm = 0.3, and ΩΛ = 0.7, H0 = 70 km s-1Mpc-1 and define Lν[ergs-1Hz-1] as the luminosity per unit frequency at a frequency ν = c/λ (c: the speed of light) throughout this paper.
2. Data
The newest version of the AKARI all sky survey FIS catalogue consists of 950 365 sources, out of which 410 623 (43%) posses measurements in all four passbands. The point spread function of AKARI FIR bands is reported to be 37 ± 1′′ for N60 band, 39 ± 1′′ for WIDE-S band, 58 ± 3′′ for WIDE-L band and 61 ± 4′′ for N160 band (Kawada et al. 2007). To ensure a good quality of photometric measurements we choose those objects that have been scanned by AKARI at least three times and posses the flux quality indicator FQUAL = 3 at 90 μm. The depth of the catalogue at 90 μm filter where we consider only sources with signal to noise ratios above 5, reaches ~0.2 [Jy].
Following (Pollo et al. 2010) we select objects lying in regions associated with low Galactic emission at 100 μm. To obtain the 100 μm emission from the Milky Way we used the SFD maps (Schlegel et al. 1998). We have set the threshold to 5 MJy sr-1, which leaves us with a catalogue composed of 61 576 (6%) sources. The distribution of those sources on the sky is shown in Fig. 1.
2.1. Matching with IRAS FSC catalogue
In order to provide reliable estimates of the total infrared luminosities, a robust catalogue of FIR sources confirmed as galaxies is needed. To this aim, we cross-matched the AKARI FIS bright source catalogue ver. 2 with IRAS faint source catalogue (FSC; Moshir et al. 1992). The FSC contains data for 173 044 point sources in unconfused regions with flux densities typically greater than 0.2 Jy at 12, 25, and 60 μm and greater than 0.4 Jy at 100 μm. We searched for IRAS FSC counterparts within AKARI BSCv2 in a radius of 20 arcsec, corresponding to the position uncertainty of the IRAS FSC. When a source had multiple counterparts detected in IRAS FSC catalogue, the closest matching object was selected as a counterpart. The total number of crossmatched sources was 2430 and there are measurements obtained by IRAS satellite in all its passbands for all those objects.
We compared the AKARI and IRAS flux densities to examine our sample selection to see which selection controls the sample selection. The relation is presented in Fig. 2. The AKARI FIS selection of sources is based on WIDE-S measurements and after the crossmatching procedure we found that the 90 μm flux density limit of the final source sample is ~0.3 Jy.
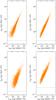 |
Fig. 2 Comparison between the AKARI FIS and IRAS FSC flux densities. Upper-left, upper-right, and lower-left panels: comparisons of the IRAS 60 μm with AKARI 90 μm, 65 μm, and 140 μm flux densities of the AKARI-IRAS correlated sample. Lower-right panel: a comparison of the IRAS 100 μm with the AKARI 90 μm flux densities. The horizontal dashed lines in these panels represent the flux density limit of the IRAS FSC. |
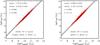 |
Fig. 3 Relation between LAKARI estimated from three (left panel) and two (right panel) AKARI FIS bands and LTIR estimated from Sanders & Mirabel (1996). The solid lines present the best least-square fits to the data, and the dashed lines mark the 95% prediction interval of the linear regression. |
3. Total infrared luminosity calibration
To measure the total infrared luminosity (LTIR) we used a classical formula measuring luminosity between λ = 8−1000μm presented by Sanders & Mirabel (1996) for IRAS bands (centred at 12 μm, 25 μm, 60 μm and 100 μm): ![Mathematical equation: \begin{eqnarray} \label{sm} L_{\mathrm{TIR}} [L_{\odot}]&=&4.93\times 10^{-22}[13.48L_{\nu}(12~\mu\mbox{m})+5.16L_{\nu}(25~\mu\mbox{m})\nonumber\\&&\quad\quad\quad +2.58L_{\nu}(60~\mu\mbox{m})+L_{\nu}(100~\mu\mbox{m})]. \end{eqnarray}](/articles/aa/full_html/2016/08/aa29062-16/aa29062-16-eq25.png) (1)To obtain specific luminosities per unit frequency (Lν) we first measured the luminosity distance to each source as
(1)To obtain specific luminosities per unit frequency (Lν) we first measured the luminosity distance to each source as  (2)where
 (3)and
  is the Hubble distance. Then, to calculate specific luminosities we used
  , where Sν is the flux density measured for each source through a specific filter. To obtain the relationships between LTIR and specific AKARI FIS luminosities we fitted a following model: y = a ∗ x + b, where y = log (LTIR) and x = log (LAKARI − FISfilter).
Following Hirashita et al. (2008) and Takeuchi et al. (2010) we took advantage of the continuous wavelength coverage of AKARI FIS bands (from ~50μm to ~160μm) and used their definition of IR flux by taking a sum of flux densities multiplied by their bandwidths: 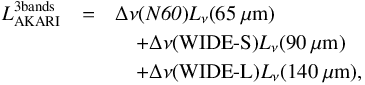 (4)where Δν(N60) = 1.58 × 10¹² [Hz], Δν(WIDE - S) = 1.47 × 10¹² [Hz], Δν(WIDE - L) = 0.831 × 10¹² [Hz].
As Takeuchi et al. (2010) reported, N60 filter sensitivity is lower than that of the wide bands, and therefore defined IR luminosity by using only WIDE-S and WIDE-L bands: 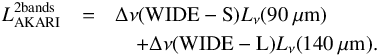 (5)In Fig. 3 we present correlations between LTIR and both definitions of LAKARI. We found the relations (shown in Fig. 3) as follows:
 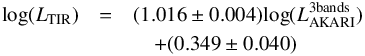 (6)with correlation coefficient r = 0.988, and
 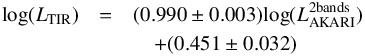 (7)with r = 0.982. The envelopes delineated by the dashed lines are 95% prediction interval of the linear regression. The scatter around the two best fits is approximately equal, with σ = 0.11 for
  and σ = 0.09 for
  .
.
4. Conclusions and summary
In this work we used the new release of the AKARI all sky survey catalogue performed at FIR and covering the wavelength range from 50 to 180 μm to recalibrate the formula to obtain total infrared luminosities. We find very tight correlations between the luminosity estimates from AKARI FIS catalogue and luminosity estimates from IRAS FSC catalogue. We do not find any significant enhancement of the correlations when only two wide filters are used instead of three AKARI-FIS filter combination (N60, WIDE - S, WIDE - L).
Acknowledgments
This work is based on observations with AKARI, a JAXA project with the participation of ESA. We thank I. Yamamura and K. Murata (ISAS) for providing useful comments which helped to improve this manuscript. A.S. was supported by the National Science Centre grant UMO-2015/16/S/ST9/00438. TTT has been supported by the Grant-in- Aid for the Scientific Research Fund (24111707), commissioned by the Ministry of Education, Culture, Sports, Science and Technology (MEXT) of Japan, and for the JSPS Strategic Young Researcher Overseas Visits Program for Accelerating Brain Circulation, “Construction of a Global 7 Platform for the Study of Sustainable Humanosphere”. AP has been supported by the National Science Centre grant UMO-2012/07/B/ST9/04425. The authors would like to thank the anonymous referee for comments and recommendations that have improved this work.
References
- Buat, V., Takeuchi, T. T., Iglesias-Páramo, J., et al. 2007, ApJS, 173, 404 [NASA ADS] [CrossRef] [Google Scholar]
- Dale, D. A. & Helou, G. 2002, ApJ, 576, 159 [NASA ADS] [CrossRef] [Google Scholar]
- Dale, D. A., Helou, G., Contursi, A., Silbermann, N. A., & Kolhatkar, S. 2001, ApJ, 549, 215 [NASA ADS] [CrossRef] [Google Scholar]
- Draine, B. T. & Li, A. 2007, ApJ, 657, 810 [NASA ADS] [CrossRef] [Google Scholar]
- Helou, G., Khan, I. R., Malek, L., & Boehmer, L. 1988, ApJS, 68, 151 [NASA ADS] [CrossRef] [Google Scholar]
- Hirashita, H., Kaneda, H., Onaka, T., & Suzuki, T. 2008, PASJ, 60, S477 [NASA ADS] [Google Scholar]
- Kawada, M., Baba, H., Barthel, P. D., et al. 2007, PASJ, 59, S389 [NASA ADS] [CrossRef] [Google Scholar]
- Kessler, M. F., Steinz, J. A., Anderegg, M. E., et al. 1996, A&A, 315, L27 [NASA ADS] [Google Scholar]
- Moshir, M., Kopman, G., & Conrow, T. A. O. 1992, IRAS Faint Source Survey, Explanatory supplement version 2 [Google Scholar]
- Pollo, A., Rybka, P., & Takeuchi, T. T. 2010, A&A, 514, A3 [NASA ADS] [CrossRef] [EDP Sciences] [Google Scholar]
- Sanders, D. B. & Mirabel, I. F. 1996, ARA&A, 34, 749 [NASA ADS] [CrossRef] [Google Scholar]
- Schlegel, D. J., Finkbeiner, D. P., & Davis, M. 1998, ApJ, 500, 525 [NASA ADS] [CrossRef] [Google Scholar]
- Schulz, N. S. 2005, From Dust To Stars Studies of the Formation and Early Evolution of Stars (Praxis Publishing) [Google Scholar]
- Soifer, B. T., Neugebauer, G., & Houck, J. R. 1987, ARA&A, 25, 187 [NASA ADS] [CrossRef] [Google Scholar]
- Stahler, S. W. & Palla, F. 2004, The Formation of Stars (Westview Press) [Google Scholar]
- Takeuchi, T. T., Buat, V., & Burgarella, D. 2005a, A&A, 440, L17 [NASA ADS] [CrossRef] [EDP Sciences] [Google Scholar]
- Takeuchi, T. T., Ishii, T. T., Nozawa, T., Kozasa, T., & Hirashita, H. 2005b, MNRAS, 362, 592 [NASA ADS] [CrossRef] [Google Scholar]
- Takeuchi, T. T., Buat, V., Heinis, S., et al. 2010, A&A, 514, A4 [NASA ADS] [CrossRef] [EDP Sciences] [Google Scholar]
- Werner, M. W., Roellig, T. L., Low, F. J., et al. 2004, ApJS, 154, 1 [Google Scholar]
- Williams, J. P., Blitz, L., & McKee, C. F. 2000, Protostars and Planets IV, 97 [Google Scholar]
All Figures
|
Fig. 1 Sky distribution of the AKARI FIS sources from the new catalogue with areas of high 100 μm emission removed. |
| In the text | |
|
Fig. 2 Comparison between the AKARI FIS and IRAS FSC flux densities. Upper-left, upper-right, and lower-left panels: comparisons of the IRAS 60 μm with AKARI 90 μm, 65 μm, and 140 μm flux densities of the AKARI-IRAS correlated sample. Lower-right panel: a comparison of the IRAS 100 μm with the AKARI 90 μm flux densities. The horizontal dashed lines in these panels represent the flux density limit of the IRAS FSC. |
| In the text | |
|
Fig. 3 Relation between LAKARI estimated from three (left panel) and two (right panel) AKARI FIS bands and LTIR estimated from Sanders & Mirabel (1996). The solid lines present the best least-square fits to the data, and the dashed lines mark the 95% prediction interval of the linear regression. |
| In the text | |
Current usage metrics show cumulative count of Article Views (full-text article views including HTML views, PDF and ePub downloads, according to the available data) and Abstracts Views on Vision4Press platform.
Data correspond to usage on the plateform after 2015. The current usage metrics is available 48-96 hours after online publication and is updated daily on week days.
Initial download of the metrics may take a while.