Fig. 2
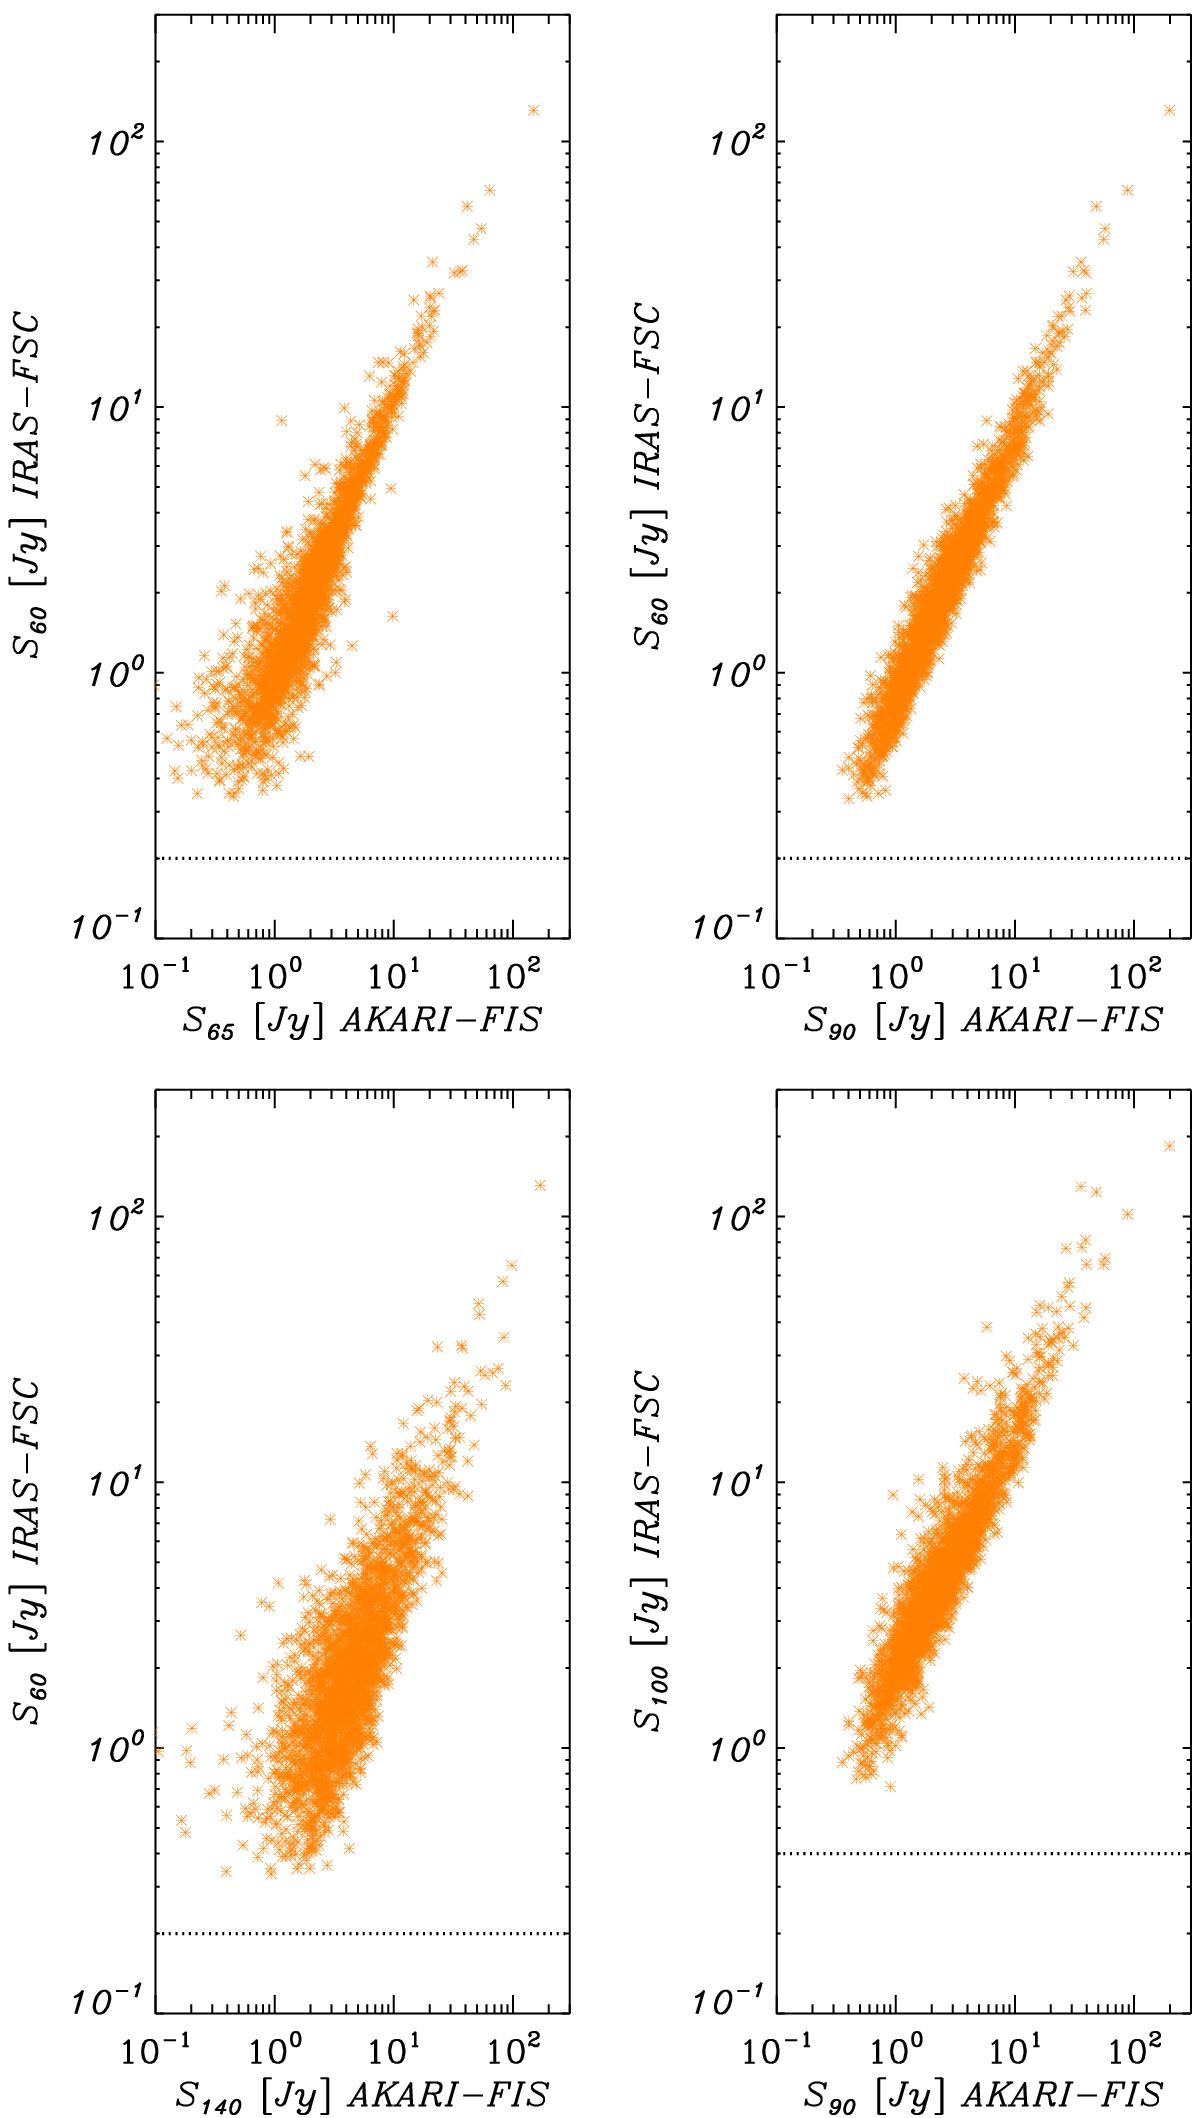
Comparison between the AKARI FIS and IRAS FSC flux densities. Upper-left, upper-right, and lower-left panels: comparisons of the IRAS 60 μm with AKARI 90 μm, 65 μm, and 140 μm flux densities of the AKARI-IRAS correlated sample. Lower-right panel: a comparison of the IRAS 100 μm with the AKARI 90 μm flux densities. The horizontal dashed lines in these panels represent the flux density limit of the IRAS FSC.
Current usage metrics show cumulative count of Article Views (full-text article views including HTML views, PDF and ePub downloads, according to the available data) and Abstracts Views on Vision4Press platform.
Data correspond to usage on the plateform after 2015. The current usage metrics is available 48-96 hours after online publication and is updated daily on week days.
Initial download of the metrics may take a while.