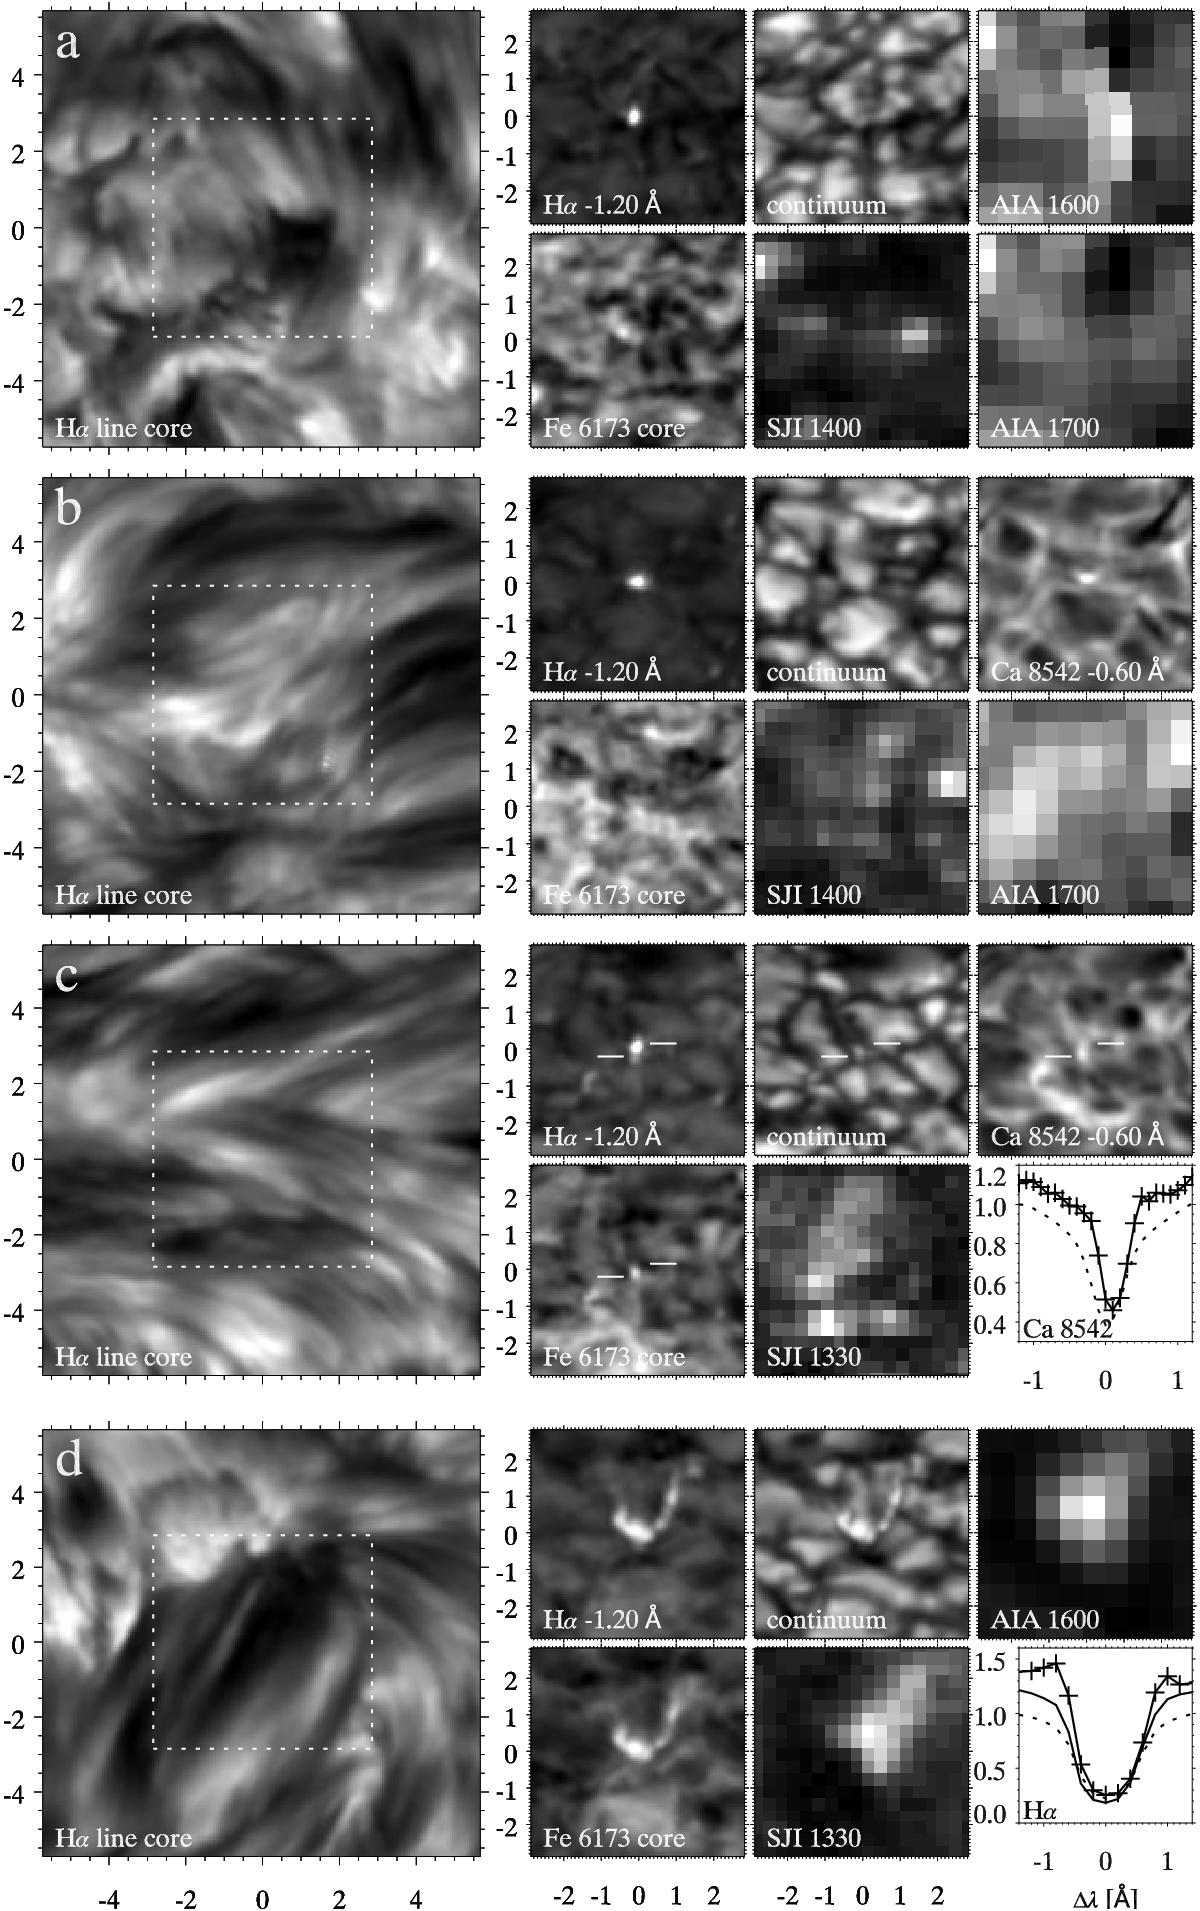
Fig. 5
Three QSEBs and one pseudo-QSEB in Hα line center over a fairly wide field of view (first column) and in smaller image cutouts clockwise sampling the blue wing of Hα, the wide-band continuum around Hα, AIA 1600 Å or Ca ii 8542 Å wing, AIA 1700 Å, IRIS slit-jaw 1400 Å or 1330 Å, and the core of Fe i 6173 Å. The dotted frame in the first column specifies the smaller cutouts at right. The axis units are arcsec from the feature at (0,0). The first row is from dataset 8 (μ = 0.64), the others are from dataset 7 (μ = 0.73). The QSEB in row c) is the same as in Fig. 2e; for this one the AIA 1700 image is replaced by a Ca ii 8542 Å profile plot. White horizontal markers are added to guide the eye: the QSEB visible in the Hα wing is slightly above the small bright point also visible in the other SST diagnostics (marked with the lower left marker). Row d) shows a pseudo-QSEB, i.e., facular striations. The AIA 1700 Å image is replaced by a plot of the Hα profile of the facula at image center (solid profile without crosses). The other profiles (with crosses and dashed) are for the QSEB and its reference spectrum in row c), copied from Fig. 2e.
Current usage metrics show cumulative count of Article Views (full-text article views including HTML views, PDF and ePub downloads, according to the available data) and Abstracts Views on Vision4Press platform.
Data correspond to usage on the plateform after 2015. The current usage metrics is available 48-96 hours after online publication and is updated daily on week days.
Initial download of the metrics may take a while.