Fig. 3
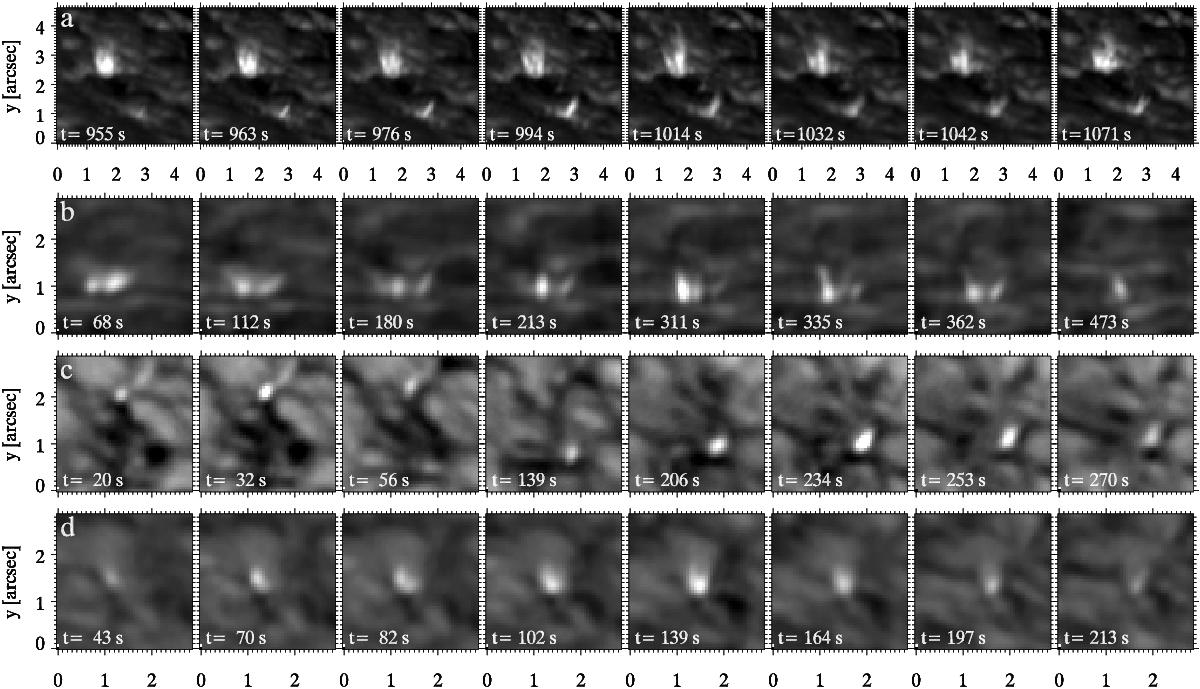
Temporal evolution of Ellerman features at 1-s cadence in Hα wide-band (FWHM = 4.9 Å) image sequences. Each row of image cutouts shows selected samples with identical greyscaling per panel. The limb direction is upward. Row a) contains an active-region EB from dataset 2 (close to the limb, cutout C in Fig. 1). The other rows show QSEBs in quiet areas in yet smaller cutouts from datasets 5 b), close to the limb and 4 c) and d), μ = 0.56. The time labels specify duration from the start of each observation. Corresponding animations of this figure are available online.
Current usage metrics show cumulative count of Article Views (full-text article views including HTML views, PDF and ePub downloads, according to the available data) and Abstracts Views on Vision4Press platform.
Data correspond to usage on the plateform after 2015. The current usage metrics is available 48-96 hours after online publication and is updated daily on week days.
Initial download of the metrics may take a while.