Fig. 7
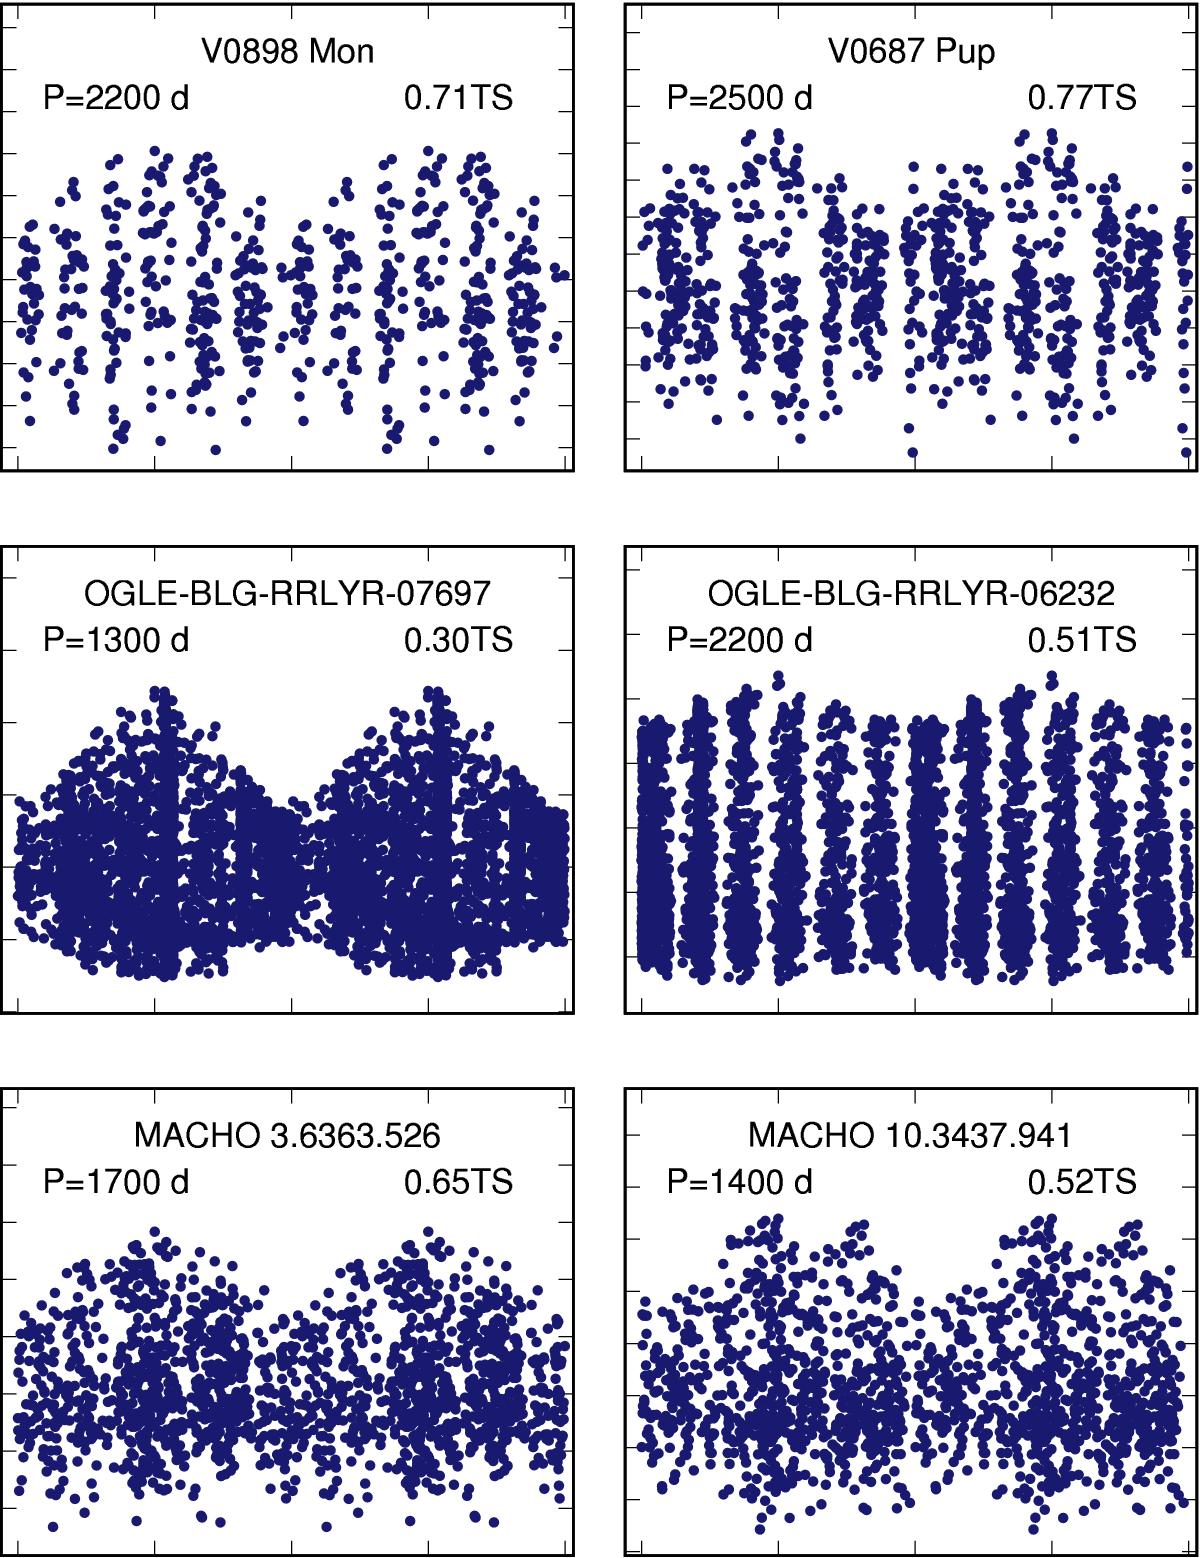
Stars originally classified as pure PC. There are stars from our sample in the top panels. The middle panels show OGLE-III data demonstrating that in long-enough data sets (original classification comes from OGLE-II data with three-times shorter time span) the stars could be classified as BL stars, not pure PC stars. The bottom panels show two stars that clearly show amplitude modulation with periods shorter than 2/3TS suggesting classification as BL+PC, not pure PC. The scales of the axes are the same as in Fig. 3.
Current usage metrics show cumulative count of Article Views (full-text article views including HTML views, PDF and ePub downloads, according to the available data) and Abstracts Views on Vision4Press platform.
Data correspond to usage on the plateform after 2015. The current usage metrics is available 48-96 hours after online publication and is updated daily on week days.
Initial download of the metrics may take a while.