Fig. 4
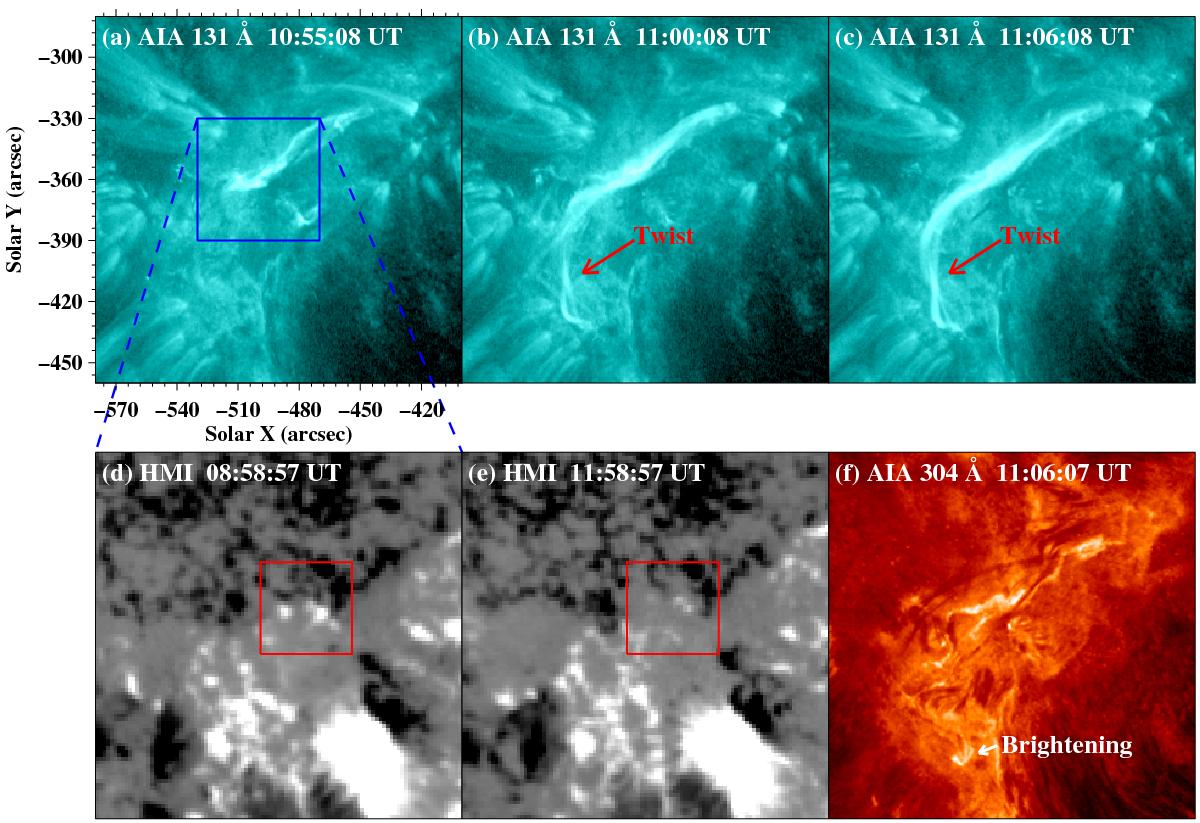
Panels a)−c): AIA 131 Å images exhibiting a flux rope proxy on 14 November 2013. The blue square in panel a) outlines the FOV of panels d) and e). Panels d)−e): corresponding HMI LOS magnetograms showing the evolution of the underneath magnetic fields. The red squares denote the region where magnetic cancellation occurred. Panel f): AIA 304 Å image with the same FOV of panels a)−c) displaying this rope proxy in a lower temperature channel. The temporal evolution of the 131 Å and 304 Å images is available as a movie (4.mp4) online.
Current usage metrics show cumulative count of Article Views (full-text article views including HTML views, PDF and ePub downloads, according to the available data) and Abstracts Views on Vision4Press platform.
Data correspond to usage on the plateform after 2015. The current usage metrics is available 48-96 hours after online publication and is updated daily on week days.
Initial download of the metrics may take a while.