Fig. 3
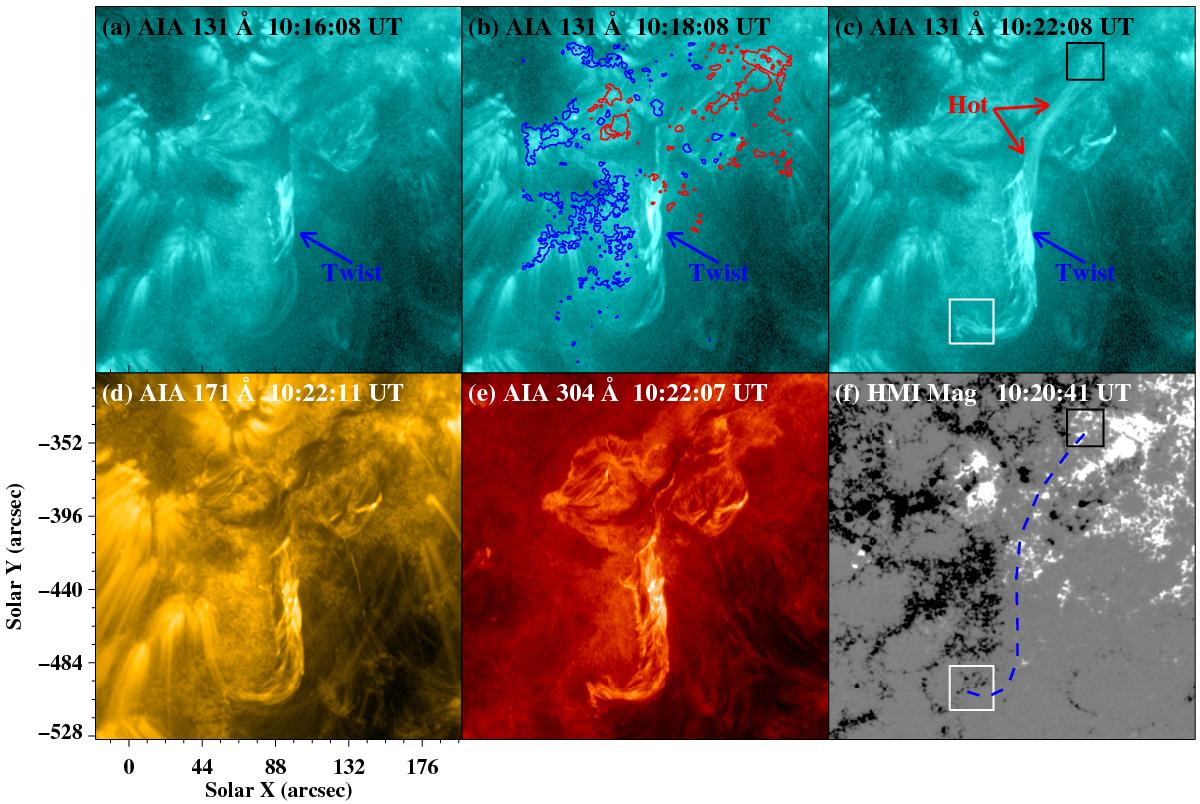
Panels a)–c): sequence of AIA 131 Å images showing a flux rope proxy tracked by active material of a filament on 17 November 2013. The blue and red curves in panel b) are contours of corresponding negative and positive magnetic fields, respectively. Panels d)–f): corresponding 171 Å and 304 Å images and HMI LOS magnetogram. In panel f), the black square denotes the positive-polarity field region where this flux rope proxy’s northwest end is rooted, while the white square denotes the negative-polarity field region at the other end. These two squares are also shown in panel c). The blue dashed line represents the main axis of this flux rope proxy. An animation (3.mp4) of the 131 Å, 171 Å, and 304 Å images is available online.
Current usage metrics show cumulative count of Article Views (full-text article views including HTML views, PDF and ePub downloads, according to the available data) and Abstracts Views on Vision4Press platform.
Data correspond to usage on the plateform after 2015. The current usage metrics is available 48-96 hours after online publication and is updated daily on week days.
Initial download of the metrics may take a while.