| Issue |
A&A
Volume 592, August 2016
|
|
|---|---|---|
| Article Number | L7 | |
| Number of page(s) | 5 | |
| Section | Letters | |
| DOI | https://doi.org/10.1051/0004-6361/201628772 | |
| Published online | 08 August 2016 | |
Direct measurement of lensing amplification in Abell S1063 using a strongly lensed high redshift HII galaxy
1 Instituto Nacional de Astrofísica
Óptica y Electrónica, AP 51 y
216, 72000 Puebla, México
e-mail: This email address is being protected from spambots. You need JavaScript enabled to view it.
2 Institute of Astronomy, University of
Cambridge, Madingley
Road, Cambridge
CB3 0HA,
UK
3 European Southern Observatory,
Av. Alonso de Cordova
3107, Santiago,
Chile
4 Observatorio Nacional,
Rua José Cristino
77, 20921-400
Rio de Janeiro,
Brasil
5 Cavendish Laboratory, University of
Cambridge, 19 J. J. Thomson
Ave, Cambridge
CB3 0HE,
UK
6 Kavli Institute for Cosmology,
University of Cambridge, Madingley
Road, Cambridge
CB3 0HA,
UK
7 Institute for Astronomy, University of Hawaii, 2680 Woodlawn
Drive, 96822 Honolulu, HI USA
8 Physics Dept., Aristotle Univ. of
Thessaloniki, Thessaloniki
54124,
Greece
9 National Observatory of Athens,
P. Pendeli,
Athens,
Greece
10 Academy of Athens,
Research Center for Astronomy
& App. Math., Soranou Efesiou 4, 11527
Athens,
Greece
11 Departamento de Física Teórica,
Universidad Autónoma de Madrid, Cantoblanco, 28049
Madrid,
Spain
Received:
22
April
2016
Accepted:
8
July
2016
Abstract
ID11 is an actively star-forming, extremely compact galaxy and Lyα emitter at z = 3.117 that is gravitationally magnified by a factor of ~17 by the cluster of galaxies Hubble Frontier Fields AS1063. The observed properties of this galaxy resemble those of low luminosity HII galaxies or giant HII regions such as 30 Doradus in the Large Magellanic Cloud. Using the tight correlation correlation between the Balmer-line luminosities and the width of the emission lines (typically L(Hβ) − σ(Hβ)), which are valid for HII galaxies and giant HII regions to estimate their total luminosity, we are able to measure the lensing amplification of ID11. We obtain an amplification of 23 ± 11 that is similar within errors to the value of ~17 estimated or predicted by the best lensing models of the massive cluster Abell S1063. We also compiled, from the literature, luminosities and velocity dispersions for a set of lensed compact star-forming regions. There is more scatter in the L−σ correlation for these lensed systems, but on the whole the results tend to support the lensing model estimates of the magnification. Our result indicates that the amplification can be independently measured using the L − σ relation in lensed giant HII regions or HII galaxies. It also supports the suggestion, even if lensing is model dependent, that the L − σ relation is valid for low luminosity high-z objects. Ad hoc observations of lensed star-forming systems are required to determine the lensing amplification accurately.
Key words: galaxies: starburst / galaxies: clusters: general / gravitational lensing: strong
© ESO, 2016
1. Introduction
Gravitational lensing is a powerful tool to study the properties of distant low luminosity objects and to estimate the mass profiles of clusters of galaxies. However, as reviewed by Kneib & Natarajan (2011) and discussed by Birrer et al. (2016) each mass mapping method has its own approach that translates into uncertainties in the recovered mass maps. On top of this most if not all methods suffer from mass-sheet degeneracy, which also leads to non-unique estimates of the total mass of the clusters (see Fig. 1 of Priewe et al. 2016). To circumvent this, Bertin & Lombardi (2006) and Sonnenfeld et al. (2011) explored possible methods to make direct measurements of the magnification. In particular, they proposed using the fundamental plane of elliptical galaxies as a standard rod or the Tully-Fisher relation for spiral galaxies as a standard candle. Unfortunately both methods suffer from important weaknesses that hamper their use at high redshifts, such as the uncertainty regarding the possible evolution of the fundamental plane or the observational challenges of applying the Tully-Fisher relation to high-z spiral galaxies. In fact any distant estimator or standard candle can be used in lensed systems to measure its magnification. Indeed SNIa have already been used to directly measure the cluster magnification (Rodney et al. 2015). HII galaxies have also been used; Fosbury et al. (2003) found inconsistencies between the lensing models and the intrinsic luminosity predicted by the Melnick et al. (2000)L − σ correlation for two massive star-forming regions in the Lynx arc.
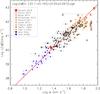 |
Fig. 1 Luminosity − velocity dispersion relation for HII galaxies and giant HII regions with added de-lensed systems. Orange dots are HII galaxies with redshifts between 0.6 and 2.4. ID11 is represented by the red star near the centre of the plot at σ[Hβ] = 23.0 km s-1 and at the observed luminosity de-amplified by 0.06 L(Hβ)obs = 40.15 erg s-1. ID11 lies in a region of the diagram that is populated by low luminosity HII galaxies and luminous giant HII regions. The open brown triangles joined by a dashed line are the Fosbury et al. Lynx arc data, with σ determined from the semi-forbidden lines and from CIV (see text). Other lensed systems are plotted with a variety of symbols as listed in the inset. The brown cross near ID11 corresponds to A4.1. The equation at the top is the fit to 131 HII galaxies and giant HII regions from Terlevich et al. (2015) shown with the red solid line. |
Recently Caminha et al. (2015) reported the discovery of multiple images of a strong lensed star-forming galaxy at z = 3.117 located behind the Hubble Frontier Fields1 cluster Abell S1063 (AS1063). This galaxy, named ID11, is one of the lowest luminosity Ly α blobs found to date.
In a recent paper Vanzella et al. (2016) reported new high quality observations of ID11. Spectroscopy with MUSE and X-shooter on the Very Large Telescope (VLT) indicates that ID11 is a compact (Reff ≃ 67 pc), young (age < 20 Myr), low mass (M< 107M⊙) and dust-free galaxy, thus strongly resembling low redshift HII galaxies or giant HII regions, such as 30 Doradus in the Large Magellanic Cloud (Terlevich & Melnick 1981; Terlevich et al. 1991).
A key property of HII galaxies and giant HII regions is that they follow a tight correlation between the widths of their emission lines and their Balmer-line (typically Hβ) luminosities, i.e. the L − σ correlation, as shown in Fig. 1 (see Chávez et al. 2014, for a detailed discussion and list of references). Having shown that the L − σ correlation provides a powerful cosmological probe, we have engaged in a programme to measure the emission line widths and luminosities of a large sample of HII galaxies out to redshifts of z ~ 3 using multi-object IR spectrographs on the VLT and Keck telescopes (see Terlevich et al. 2015).
As the L − σ correlation is valid up to redshifts of at least z ~ 2.5 (Melnick et al. 2000; Siegel et al. 2005; Terlevich et al. 2015), and prompted by Vanzella et al. (2016) results on ID11, we decided to use the L − σ relation to measure the lensing amplification in Abell S1063 directly and, simultaneously, check its validity for low luminosity high-z, star-forming regions.
2. Results
The measurements for the relevant lines from Vanzella et al. (2016) are reproduced in Table 1, where the line widths have already been corrected for instrumental broadening. The fluxes obtained combining two of the lensed images of the galaxy have not been corrected for internal reddening, but the authors indicate that the extinction in this object is negligible. They do not quote observational errors, but judging by the S/N, the error in the Hβ flux is of the order of 25%. The errors in the [OIII] line widths are of the order of 2−3 km s-1and much larger for the weaker Hβ. Therefore we use the [OIII] line width for this exercise.
In order to apply the L − σ relation we need to correct the line widths for thermal broadening. This correction is in general small for oxygen, but the detection of HeIIλ1640 Å in emission in ID11 indicates that the ionized gas must be extremely hot. In fact Vanzella et al. (2016) reported a metallicity of 12+log(O/H) < 7.8 and an electron temperature of Te = 26500 ± 2600 K from the OIII]λ1666 Å/[OIII]λ5007 Å ratio. Although this value of the electron temperature is on the high side compared to that of most low metallicity HII regions, we used it to compute the thermal broadening of the oxygen lines as σth = 3.5km s-1.
The velocity dispersion of ID11, obtained from the weighted average of the two [OIII] lines is FWHM = 51.4km s-1± 2.0 km s-1, and corrected for thermal broadening is ![Mathematical equation: \begin{equation} \sigma_{\rm [0III]}=\sqrt{(51.4/2.355)^2-3.5^2}=21.5 \pm 0.9 ~\rm km ~s^{-1} , \end{equation}](/articles/aa/full_html/2016/08/aa28772-16/aa28772-16-eq29.png) (1)which for the present purposes is not significantly different from the observed value of 21.8 km s-1.
(1)which for the present purposes is not significantly different from the observed value of 21.8 km s-1.
Balmer lines are observed to be systematically broader than [OIII] by about 1.4 km s-1(Hippelein 1986) for giant HII regions and HII galaxies, so a correction must be included before using the L − σ relation of Chávez et al. (2014) that is defined for Hβ. Thus, we estimate for ID11 that the velocity dispersion of the Balmer lines is σHβ = 23.0km s-1
The L − σ relation, as calibrated in Chávez et al. (2012) using 92 giant HII regions and HII galaxies is  (2)which for σHβ = 23 km s-1 predicts log L(Hβ)pred = 40.02 ± 0.22 erg s-1; the error has been computed as
 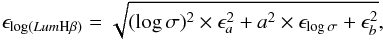 (3)where a is the slope, b is the intercept of the L − σ relation, and ϵa,ϵb and ϵlog σ are the errors in the slope, intercept, and velocity dispersion, respectively.
The more recent calibration of the L − σ relation by Terlevich et al. (2015) with a larger sample of HII galaxies, including high redshift galaxies with redshifts between 0.6 and 2.33 is  (4)In this case, we obtain logL(Hβ)pred = 39.99 ± 0.21 erg s-1, again propagating the errors with Eq. (3).
The observed Hβ flux of ID11 from Table 1 is F(Hβ) = 3.1 × 10⁻¹⁸ergs-1cm-2 (assuming negligible extinction as reported by Vanzella et al. 2016). At a redshift of z = 3.117 and for the cosmology adopted in Chávez et al. (2014) (H0 = 74.3;Ωm = 0.3;Ω0 = 1), this flux corresponds to a photometric luminosity of log L(Hβ)obs = 41.37 erg s-1. Thus, the measured amplification is, from Eq. (2)  (5)or, from Eq. (4)
  (6)in remarkable agreement with the magnification of μ ~ 17 reported by Vanzella et al. (2016) from the cluster lensing models of Caminha et al. (2015).
We have assumed a photometric error of 0.1 dex in the observed Hβ flux, but the uncertainty in our predicted luminosity basically stems from the dispersion of the L − σ relation. Hence, it is unlikely that more and better data will yield a more stringent test of the lensing model with just one lensed HII galaxy.
Observations of ID11 from Vanzella et al. (2016).
The fact that the model demagnified luminosity (log L(Hβ) = 40.15) agrees so well with the value expected from the L − σ relation from the observed ionized gas velocity dispersion (log L(Hβ) = 40.02) provides strong confirmation that ID11 is either a bona-fide HII galaxy or a giant HII region. This can be seen in Fig. 1, where we reproduce the L − σ correlation from Terlevich et al. (2015) including nearby and high redshift HII galaxies and giant HII regions in nearby galaxies with accurate distances determined with Cepheids.
ID11 (shown by the red star) lies in the transition region between giant HII regions and HII galaxies. Given that the deep Hubble Space Telescope (HST) images of ID11 of Vanzella et al. (2016) reveal no indication of an underlying galaxy, we concur with them in classifying ID11 as a low luminosity HII galaxy at z = 3.117.
3. Discussion
As mentioned in the introduction, this is not the first time the L − σ relation is used in this context. Fosbury et al. (2003) found inconsistencies between the lensing models and the intrinsic luminosity predicted by the Melnick et al. (2000)L − σ correlation on two compact and luminous star-forming regions in the Lynx arc. Fosbury et al. (2003) used the line profiles of two UV semi-forbidden lines, OIII]λ1666 Å and the CIII]λλ1907,1909 Å doublet, which gave instrumental-corrected velocity dispersions of 35 and 30 km s-1, respectively. These authors also reported model-corrected velocity dispersions of the absorption affected Lyαλ1216 Å and CIVλ1550 Å permitted lines of 150 and 80 km s-1, respectively. In many star-forming galaxies, Lyα is clearly asymmetric, which renders its use for determining the line profile and, hence, velocity dispersions, very uncertain. The issue has been discussed extensively (and models constructed to reproduce it) in our own old work on Lyα emission (e.g. Kunth et al. 1998; Tenorio-Tagle et al. 1999; Mas-Hesse et al. 2003, etc.) and for high redshift objects (Pettini et al. 2000; Rhoads et al. 2000, among others). On the other hand, while CIV λ 1550 Å is also a resonance line, resonance scattering and collisional de-excitation should affect it less than in the case of Lyα because carbon is far less abundant than hydrogen and therefore has smaller optical depths; this is even more pronounced in low metallicity systems.
To investigate this issue further, we compiled luminosities and velocity dispersions from the literature for a set of lensed compact star-forming regions. The sample is listed in Table A.1. The lensed systems are also shown in Fig. 1.
While ID11 and notably also A4.1 fall in the transition region between HII galaxies and giant HII regions, the rest of the lensed systems are among the most luminous star-forming systems and occupy a region of the diagram corresponding to the most luminous HII galaxies. The Lynx arc result from Fosbury et al. (2003) is shown with two different values of velocity dispersion; the lower value corresponds to the semi-forbidden lines and the higher value corresponds to the fit to the permitted CIVλ 1550 Å line. There is more scatter in the lensed systems, but on the whole the results tend to support the lensing model estimates of the magnification apart from the Lynx arc result when using semi-forbidden lines.
There is a crucial general point that we need to make regarding this exercise:
The luminosity in these young bursts of star formation evolves quickly in timescales of few megayears, which moves their position away from the L − σ correlation to lower luminosities and smaller equivalent widths (EW) of Hβ or Hα (Melnick et al. 2000; Bordalo & Telles 2011). This fact may be related to the scatter of the Richard et al. (2011) points below the L − σ relation (Fig. 1). It is therefore highly recommended to obtain and publish the EW of Hβ or Hα of star-forming systems to allow for an evolution correction to be performed.
4. Conclusions
Regarding the intrinsic properties of ID11, Fig. 1 implies that it is either a luminous giant HII region, such as 30 Doradus in the Large Magellanic Cloud or those found in spiral galaxies like M101, or a low luminosity HII galaxy. Given that the deep HST images of ID11 show no indication of an underlying galaxy, we confirm the Vanzella et al. (2016) conclusion that ID11 is a low luminosity HII galaxy at z = 3.117.
The L − σ relation spans more than three orders of magnitude in luminosity, which allows us to observe a significant number of objects at large redshifts without recourse to gravitational telescopes; hence this accounts for the power of the relation as a cosmological probe (Plionis et al. 2011; Terlevich et al. 2015; Chávez et al. 2016). But, of course, only the most luminous HII galaxies can be observed at higher redshifts with the current generation of 8−10 m telescopes, so gravitationally amplified objects such as ID11 provide us with the unique chance to verify that at high redshift the correlation holds also for low luminosity and possibly low metallicity HII galaxies.
We used an independent method, which is based on the standard candle provided by the L − σ relation that is valid for HII galaxies and giant HII regions, to measure the amplification affecting the star-forming system ID11 by the Abell cluster S0163 as 23 ± 11; this coincides with the value of ~17 obtained by Vanzella et al. (2016) from the strong lensing model of Caminha et al. (2015).
Our result suggests that we can use giant HII regions in high-z lensed galaxies as instruments for studying gravitational lenses and that the combination of the L − σ standard candle plus detailed lensing models can provide a practical method to break the mass-sheet degeneracy in the estimates of the total mass of clusters of galaxies.
High spectral resolution ad hoc observations of Hα, Hβ, and [OIII] to determine the velocity dispersion and low resolution
wide aperture spectrophotometry to determine their fluxes and EW, are needed to be able to apply this method to a larger sample of lensed star-forming galaxies, but this is beyond the scope of this Letter.
Acknowledgments
We acknowledge the careful reading and constructive comments by an anonymous referee and thank Priya Natarajan for suggestions that have improved the clarity of this letter. Roberto and Elena Terlevich acknowledge the hospitality of the Departmento de Física Teórica of the Universidad Autónoma de Madrid (UAM) and of the Institut d’Astrophysique de Paris (IAP), and the financial support of the programme Study of Emission-Line Galaxies with Integral-Field Spectroscopy (SELGIFS), funded by the EU (FP7-PEOPLE-2013-IRSES-612701) within the Marie-Sklodowska-Curie Actions scheme. Jorge Melnick acknowledges the award of a Special Visiting Researcher fellowship of the Ciencia sem fronteiras programme of the Brazilian government through their federal funding agencies − CNPq.
References
- Bertin, G., & Lombardi, M. 2006, ApJ, 648, L17 [NASA ADS] [CrossRef] [Google Scholar]
- Birrer, S., Amara, A., & Refregier, A. 2016, JCAP, submitted [arXiv:1511.03662] [Google Scholar]
- Bordalo, V., & Telles, E. 2011, ApJ, 735, 52 [NASA ADS] [CrossRef] [Google Scholar]
- Caminha, G. B., Grillo, C., Rosati, P., et al. 2016, A&A, 587, A80 [NASA ADS] [CrossRef] [EDP Sciences] [Google Scholar]
- Chávez, R., Terlevich, E., Terlevich, R, et al. 2012, MNRAS, 425, L56 [NASA ADS] [CrossRef] [Google Scholar]
- Chávez, R., Terlevich, R., Terlevich, E., et al. 2014, MNRAS, 442, 3565 [NASA ADS] [CrossRef] [Google Scholar]
- Chávez, R., Plionis, M., Basilakos, S., et al. 2016, MNRAS, accepted [arXiv:1607.06458] [Google Scholar]
- Christensen, L., Richard, J., Hjorth, J., et al. 2012, MNRAS, 427, 1953 [Google Scholar]
- Fosbury, R. A. E., Villar-Martín, M., Humphrey, A., et al. 2003, ApJ, 596, 797 [NASA ADS] [CrossRef] [Google Scholar]
- Hippelein, H. H. 1986, A&A, 160, 374 [NASA ADS] [Google Scholar]
- Jones, T. A., winbank, A. M., Ellis, R. S., et al. 2010, MNRAS, 404, 1247 [NASA ADS] [Google Scholar]
- Kneib, J., & Natarajan, P. 2011, A&ARv, 19, 47 [NASA ADS] [CrossRef] [Google Scholar]
- Kunth, D., Mas-Hesse, J. M., Terlevich, E., et al. 1998, A&A, 334, 11 [NASA ADS] [Google Scholar]
- Mas-Hesse, J. M., Kunth, D., Tenorio-Tagle, et al. 2003, ApJ, 598, 858 [NASA ADS] [CrossRef] [Google Scholar]
- Melnick J., Terlevich R., & Terlevich E. 2000, MNRAS, 311, 629 [NASA ADS] [CrossRef] [Google Scholar]
- Pettini, M., Steidel, C. C., Adelberger, K. L., Dickinson, M., & Giavalisco, M. 2000, ApJ, 528, 96 [NASA ADS] [CrossRef] [Google Scholar]
- Plionis, M., Terlevich, R., Basilakos, S., et al. 2011, MNRAS, 416, 2981 [NASA ADS] [CrossRef] [Google Scholar]
- Priewe, J., Williams, L. L. R., Liesenborgs, J., Coe, D., & Rodney, S. A. 2016, MNRAS, submitted [arXiv:1605.07621] [Google Scholar]
- Rhoads, J. E., Malhotra, S., Dey, A., et al. 2000, ApJ, 545, L85 [NASA ADS] [CrossRef] [Google Scholar]
- Richard, J., Jones, Tucker, Ellis, Richard, et al. 2011, MNRAS, 413, 643 [NASA ADS] [CrossRef] [Google Scholar]
- Rodney, S. A. 2015, ApJ, 811, 70 [NASA ADS] [CrossRef] [Google Scholar]
- Shirazi, M., Vegetti, S., Nesvadba, N., et al. 2014, MNRAS, 440, 2201 [NASA ADS] [CrossRef] [Google Scholar]
- Siegel, E. R., Guzmàn, R., Gallego, Jorge P., et al. 2005, MNRAS, 356, 1117 [NASA ADS] [CrossRef] [Google Scholar]
- Sonnenfeld, A, Bertin, G., & Lombardi, M. 2011, A&A, 532, A37 [NASA ADS] [CrossRef] [EDP Sciences] [Google Scholar]
- Tenorio-Tagle, G., S., Sergey A., Kunth, D., et al. 1999, MNRAS, 309, 332 [NASA ADS] [CrossRef] [Google Scholar]
- Terlevich, R., & Melnick, J. 1981, MNRAS, 195, 839 [NASA ADS] [CrossRef] [Google Scholar]
- Terlevich, R., Melnick, J., Masegosa, J., et al. 1991, A&AS, 91, 285 [NASA ADS] [Google Scholar]
- Terlevich, R., Terlevich, E., Melnick, J., et al. 2015, MNRAS, 451, 3001 [NASA ADS] [CrossRef] [Google Scholar]
- Teplitz, H. I., McLean, Ian S., Becklin, E. E., et al. 2000, ApJ, 533, L65 [NASA ADS] [CrossRef] [PubMed] [Google Scholar]
- Vanzella, E., De Barros, S., Cupani, G., et al. 2016, ApJ, 821, L27 [NASA ADS] [CrossRef] [Google Scholar]
- Wuyts, E., Rigby, J. R., Gladders, M. D., et al. 2014, ApJ, 781, 61 [NASA ADS] [CrossRef] [Google Scholar]
Appendix A: Additional table
Parameters for lensed compact regions of star formation compiled from the literature.
All Tables
Parameters for lensed compact regions of star formation compiled from the literature.
All Figures
|
Fig. 1 Luminosity − velocity dispersion relation for HII galaxies and giant HII regions with added de-lensed systems. Orange dots are HII galaxies with redshifts between 0.6 and 2.4. ID11 is represented by the red star near the centre of the plot at σ[Hβ] = 23.0 km s-1 and at the observed luminosity de-amplified by 0.06 L(Hβ)obs = 40.15 erg s-1. ID11 lies in a region of the diagram that is populated by low luminosity HII galaxies and luminous giant HII regions. The open brown triangles joined by a dashed line are the Fosbury et al. Lynx arc data, with σ determined from the semi-forbidden lines and from CIV (see text). Other lensed systems are plotted with a variety of symbols as listed in the inset. The brown cross near ID11 corresponds to A4.1. The equation at the top is the fit to 131 HII galaxies and giant HII regions from Terlevich et al. (2015) shown with the red solid line. |
| In the text | |
Current usage metrics show cumulative count of Article Views (full-text article views including HTML views, PDF and ePub downloads, according to the available data) and Abstracts Views on Vision4Press platform.
Data correspond to usage on the plateform after 2015. The current usage metrics is available 48-96 hours after online publication and is updated daily on week days.
Initial download of the metrics may take a while.