Fig. 1
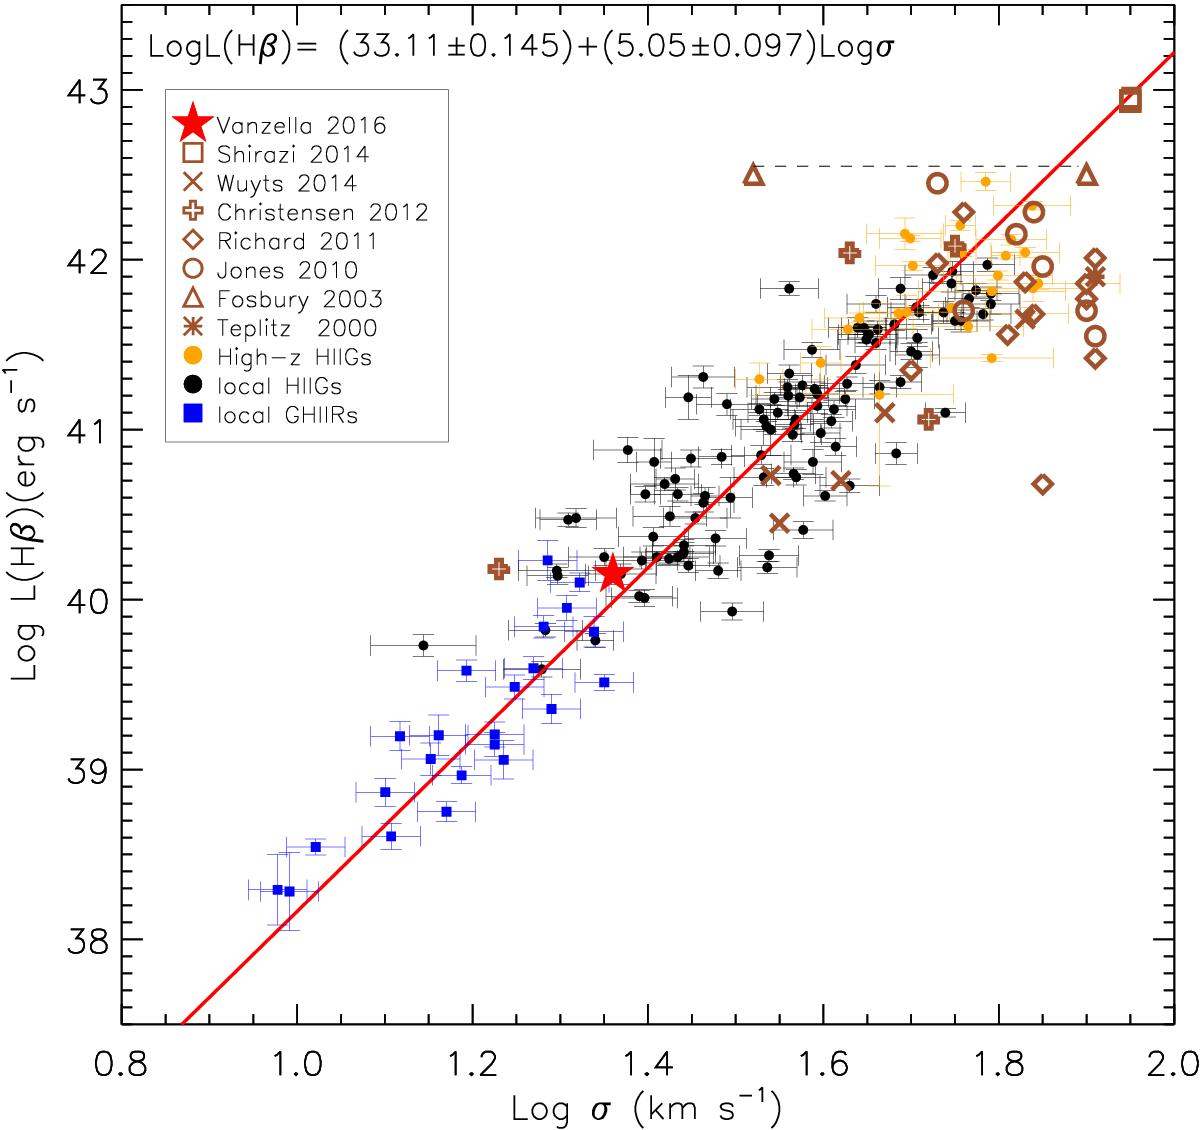
Luminosity − velocity dispersion relation for HII galaxies and giant HII regions with added de-lensed systems. Orange dots are HII galaxies with redshifts between 0.6 and 2.4. ID11 is represented by the red star near the centre of the plot at σ[Hβ] = 23.0 km s-1 and at the observed luminosity de-amplified by 0.06 L(Hβ)obs = 40.15 erg s-1. ID11 lies in a region of the diagram that is populated by low luminosity HII galaxies and luminous giant HII regions. The open brown triangles joined by a dashed line are the Fosbury et al. Lynx arc data, with σ determined from the semi-forbidden lines and from CIV (see text). Other lensed systems are plotted with a variety of symbols as listed in the inset. The brown cross near ID11 corresponds to A4.1. The equation at the top is the fit to 131 HII galaxies and giant HII regions from Terlevich et al. (2015) shown with the red solid line.
Current usage metrics show cumulative count of Article Views (full-text article views including HTML views, PDF and ePub downloads, according to the available data) and Abstracts Views on Vision4Press platform.
Data correspond to usage on the plateform after 2015. The current usage metrics is available 48-96 hours after online publication and is updated daily on week days.
Initial download of the metrics may take a while.