Fig. 8
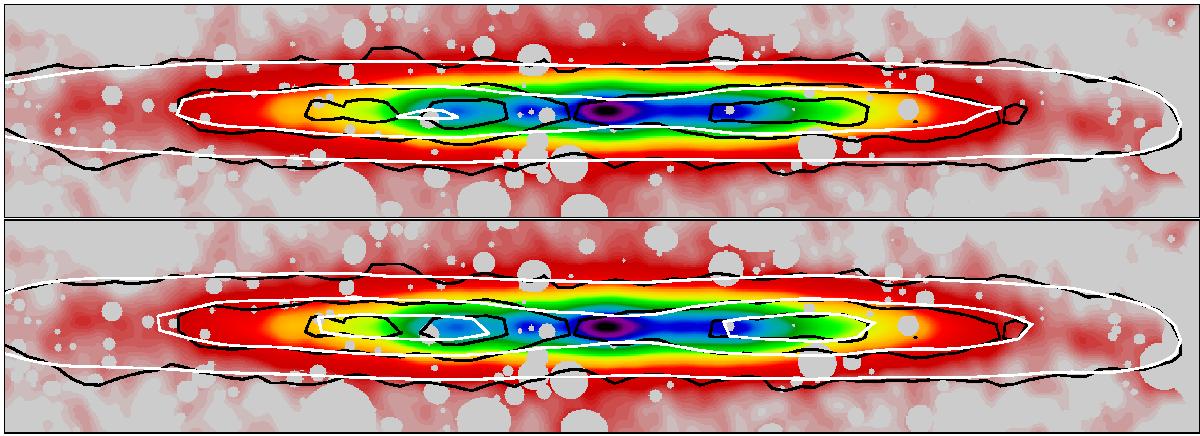
Comparison of two models from Allaert et al. (2015) without (top plot) and with arcs mimicking the effect of spiral arms (bottom plot), built on the basis of the kinematical information analyzed in their work. For both plots, the WISE W3 image is overplotted with the observed Hi contours (black) and the contours from a model (white). Contour levels are 1.49 × 10²¹, 4.475 × 10²¹ and 6.56 × 10²¹ atoms cm-2.
Current usage metrics show cumulative count of Article Views (full-text article views including HTML views, PDF and ePub downloads, according to the available data) and Abstracts Views on Vision4Press platform.
Data correspond to usage on the plateform after 2015. The current usage metrics is available 48-96 hours after online publication and is updated daily on week days.
Initial download of the metrics may take a while.