Fig. 6
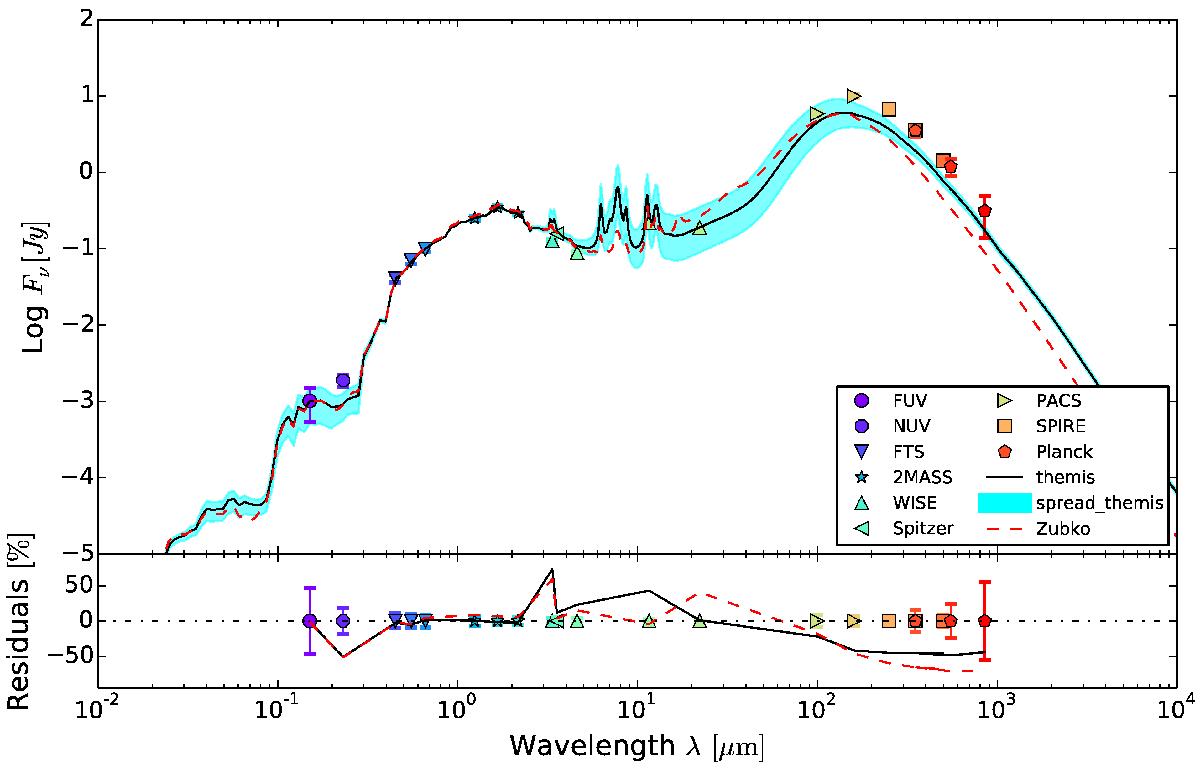
SED of IC 2531 based on the BARE-GR-S (the dashed line) and THEMIS (the solid line) dust mixture, with an additional young stellar component. The coloured symbols with error bars correspond to the flux densities listed in Table 3. The cyan band represents the spread in the MIR and FIR emission of the THEMIS model with different values of the scale height of the young stellar population (see text). The bottom panel below the SED show the relative residuals between the observed SED and the models.
Current usage metrics show cumulative count of Article Views (full-text article views including HTML views, PDF and ePub downloads, according to the available data) and Abstracts Views on Vision4Press platform.
Data correspond to usage on the plateform after 2015. The current usage metrics is available 48-96 hours after online publication and is updated daily on week days.
Initial download of the metrics may take a while.