Free Access
Fig. 2
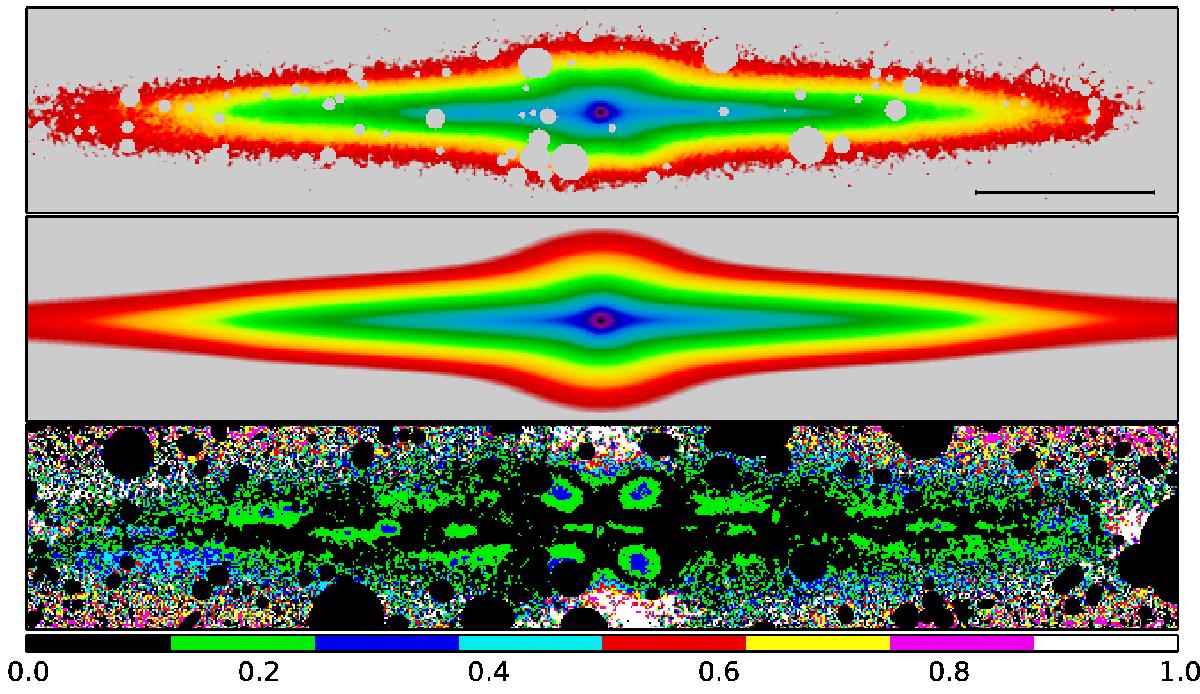
IRAC 3.6 μm image (top), best fitting image (middle) and residual image, which indicates the relative deviation between the fit and the image in absolute values (bottom). The length of the bar on the top plot corresponds to 1 arcmin. The bottom color bar shows the scaling of the residual maps.
Current usage metrics show cumulative count of Article Views (full-text article views including HTML views, PDF and ePub downloads, according to the available data) and Abstracts Views on Vision4Press platform.
Data correspond to usage on the plateform after 2015. The current usage metrics is available 48-96 hours after online publication and is updated daily on week days.
Initial download of the metrics may take a while.