Fig. 6
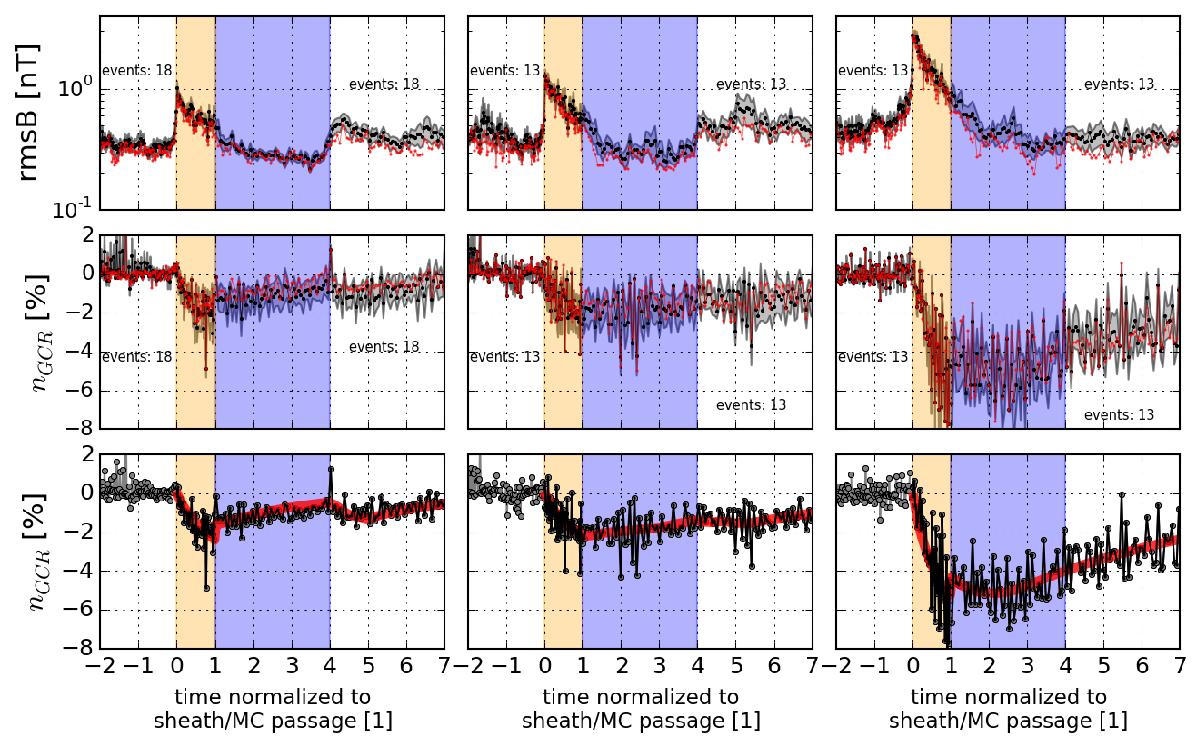
Superposed epoch for the three subsets of events. Left: slow (V< 450 km s-1); middle: medium (450 km s-1<V< 550 km s-1); and right: fast MCs (V> 550 km s-1). First row: mean profiles of magnetic fluctuations rmsB, Eq. (2). Typically, inside the MCs, the fluctuations are the same as in the ambient solar wind. For slow and middle groups, rmsB has higher values in the rear with respect to the ambient solar wind. Second row: mean profiles of GCR intensity nGCR. Before averaging events, the intensity was normalised by the pre-shock level. In the first and second rows the black line represents the average value, the grey band represents the error of the mean, and the red line represents the median values in each time bin. Third row: fitted model (red lines) to the observed average profiles (see Sect. 5.2). See the caption of Fig. 2 for more information.
Current usage metrics show cumulative count of Article Views (full-text article views including HTML views, PDF and ePub downloads, according to the available data) and Abstracts Views on Vision4Press platform.
Data correspond to usage on the plateform after 2015. The current usage metrics is available 48-96 hours after online publication and is updated daily on week days.
Initial download of the metrics may take a while.