Fig. 5
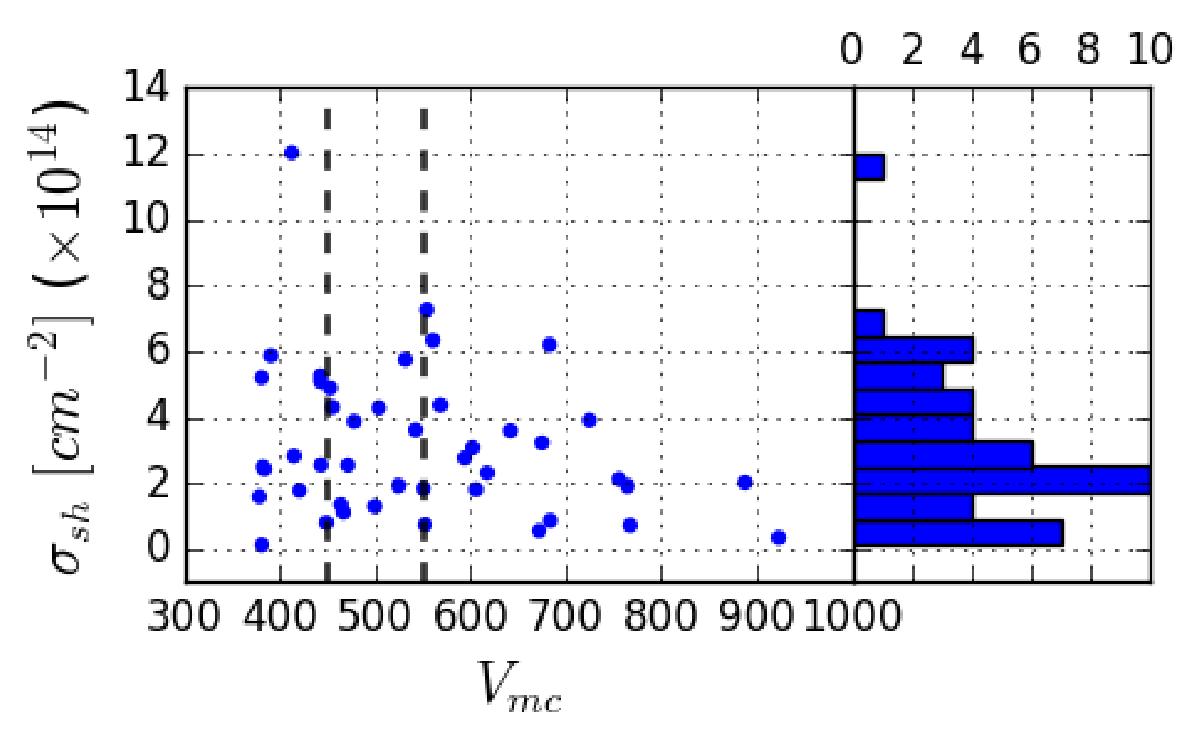
Left panel: average proton surface densities of sheaths σsh, Eq. (3), as a function of the average MC speeds (Vmc) of all events. The vertical dashed lines indicate the thresholds between the three groups shown in Figs. 4 and 6. The quantity σsh is a proxy of the accumulated material ahead of MCs, within the sheaths. On average, slower MCs drag more material. Right panel: histogram of σsh for the 44 events.
Current usage metrics show cumulative count of Article Views (full-text article views including HTML views, PDF and ePub downloads, according to the available data) and Abstracts Views on Vision4Press platform.
Data correspond to usage on the plateform after 2015. The current usage metrics is available 48-96 hours after online publication and is updated daily on week days.
Initial download of the metrics may take a while.