Fig. 4
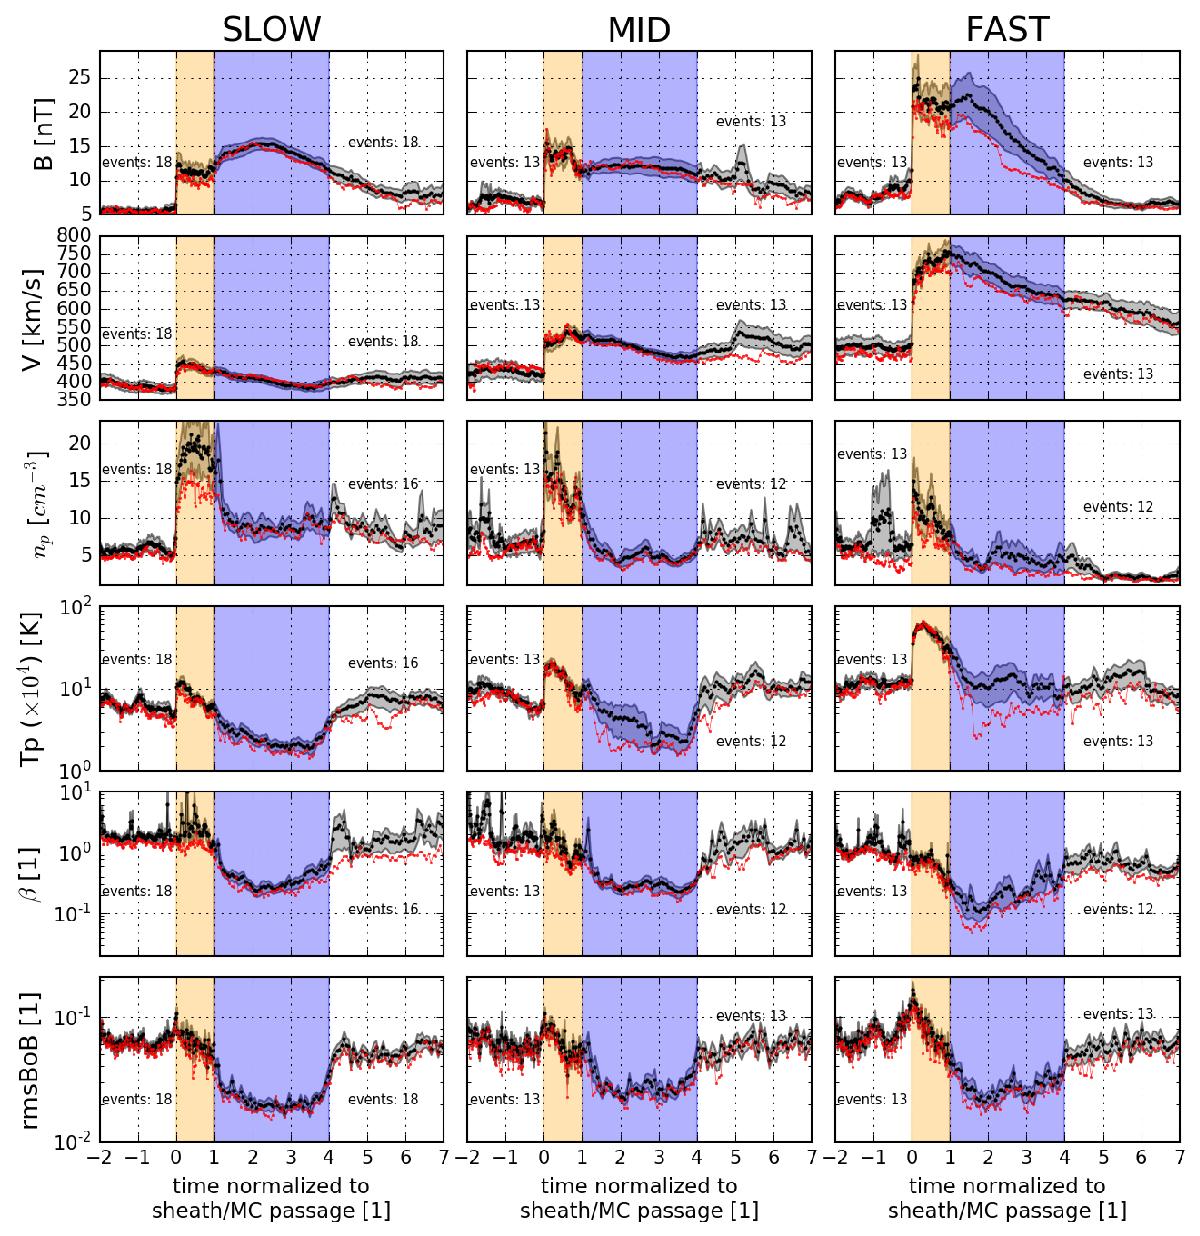
Average profiles (black lines) distributed in three columns for the three subsets of events. Left: slow (V< 450 km s-1), middle: medium (450 km s-1<V< 550 km s-1), and right: fast MCs (V> 550 km s-1). The black line represents the average value, the grey band represents the error of the mean and the red line represents the median values in each time bin. As in Fig. 2, for t< 1, time is normalised with the sheath average radial duration and for t> 1, time is normalised with the average MC radial duration. Orange delimits the sheath region (0 <t< 1), and blue the MC region (1 <t< 4). See the caption of Fig. 2 for more information. From top to bottom the parameters are the means of magnetic field B, bulk velocity V, proton density np, proton temperature Tp, plasma beta β, and normalised magnetic-fluctuation density rmsBoB, Eq. (1).
Current usage metrics show cumulative count of Article Views (full-text article views including HTML views, PDF and ePub downloads, according to the available data) and Abstracts Views on Vision4Press platform.
Data correspond to usage on the plateform after 2015. The current usage metrics is available 48-96 hours after online publication and is updated daily on week days.
Initial download of the metrics may take a while.