Fig. 1
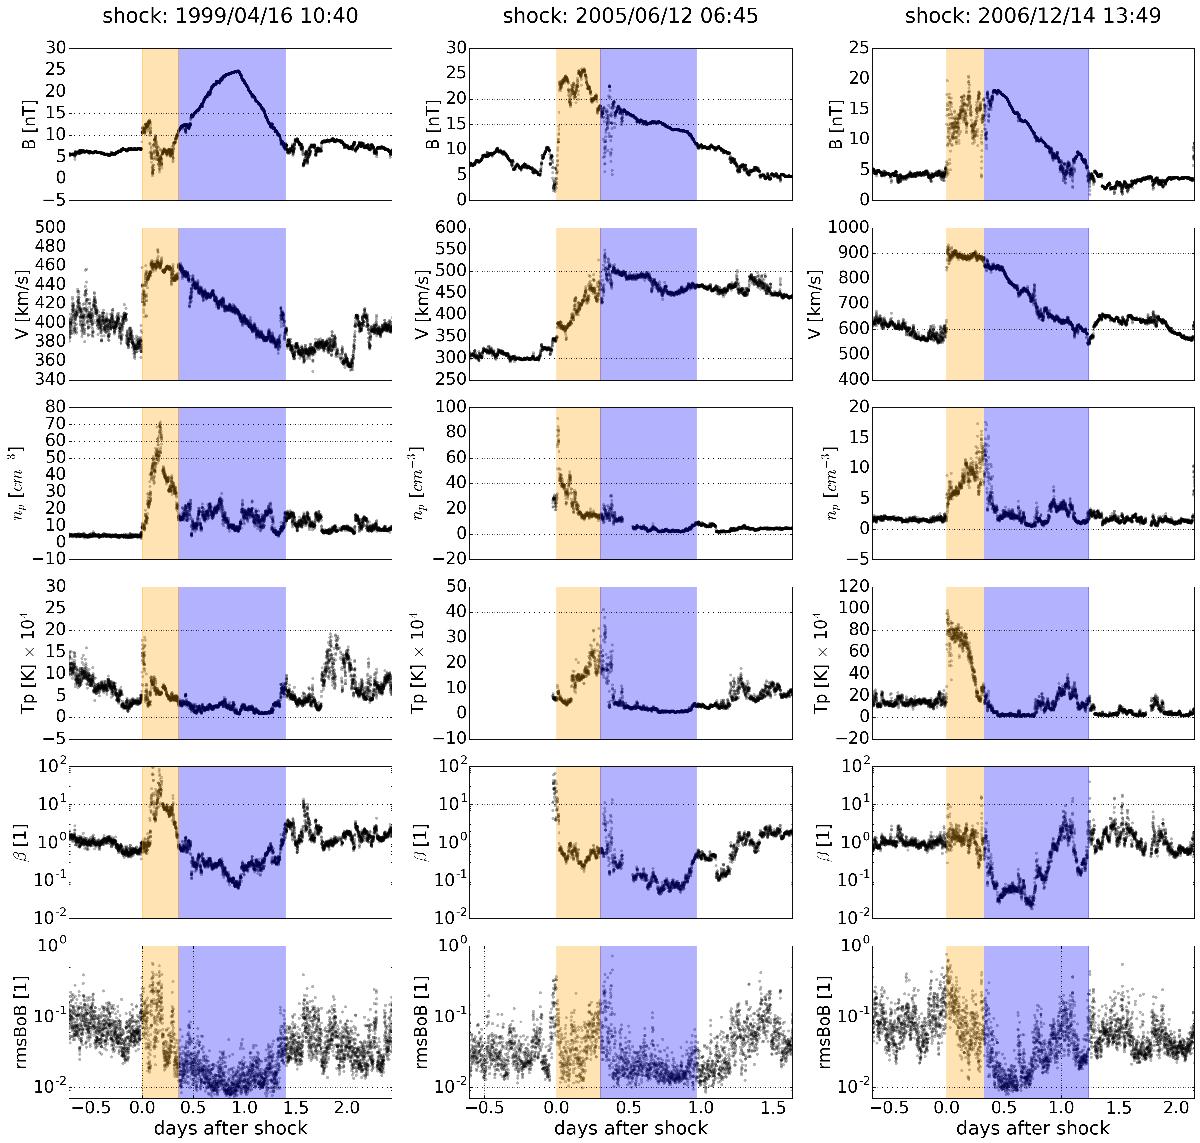
Time profiles for different observables, from top to bottom: magnetic field B, bulk velocity V, proton density np, proton temperature Tp, plasma beta β, normalised magnetic-fluctuation density rmsBoB (Eq. (1)), and absolute magnetic fluctuation rmsB (Eq. (2)). We show three different events; one per column. Each of these events belongs to each of the groups analysed in Sect. 4; from left to right, the events belong to the slow, intermediate, and fast groups. The date of the shock arrival is shown at the top of each column in UT. The passage of the sheath is indicated in orange, and the passage of the MC in blue. The fastest event shows stronger compression at the MC front, with respect to the others. The slowest event presents higher density values within the sheath. See Sect. 2.2 for a description of the main important features shown in each panel.
Current usage metrics show cumulative count of Article Views (full-text article views including HTML views, PDF and ePub downloads, according to the available data) and Abstracts Views on Vision4Press platform.
Data correspond to usage on the plateform after 2015. The current usage metrics is available 48-96 hours after online publication and is updated daily on week days.
Initial download of the metrics may take a while.