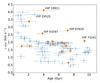
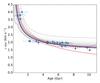
Fig. 5

Projected rotational velocity of solar twins as a function of their age. The Sun is represented by the symbol ⊙. Left panel: all stars of our sample; the orange triangles are spectroscopic binaries, blue circles are the selected sample and the blue dots are the remaining nonspectroscopic binaries. Right panel: the rotational braking law; the purple continuous curve is our relation inferred from fitting the selected sample (blue circles) of solar twins with the form vsini = vf + mt− b, where t is the stellar age, and the fit parameters are vf = 1.224 ± 0.447, m = 1.932 ± 0.431, and b = 0.622 ± 0.354, with vf and b highly and positively correlated. The light gray region is composed of 300 curves that are created with parameters drawn from a multivariate Gaussian distribution defined by the mean values of the fit parameters and their covariance matrix. Skumanich’s law (red × symbols, calibrated for ![]() km s-1) and the rotational braking curves proposed by do Nascimento et al. (2014, black dashed curve, smoothed) and Pace & Pasquini (2004, black dot-dashed curve) are plotted for comparison.
km s-1) and the rotational braking curves proposed by do Nascimento et al. (2014, black dashed curve, smoothed) and Pace & Pasquini (2004, black dot-dashed curve) are plotted for comparison.
Current usage metrics show cumulative count of Article Views (full-text article views including HTML views, PDF and ePub downloads, according to the available data) and Abstracts Views on Vision4Press platform.
Data correspond to usage on the plateform after 2015. The current usage metrics is available 48-96 hours after online publication and is updated daily on week days.
Initial download of the metrics may take a while.