Fig. 3
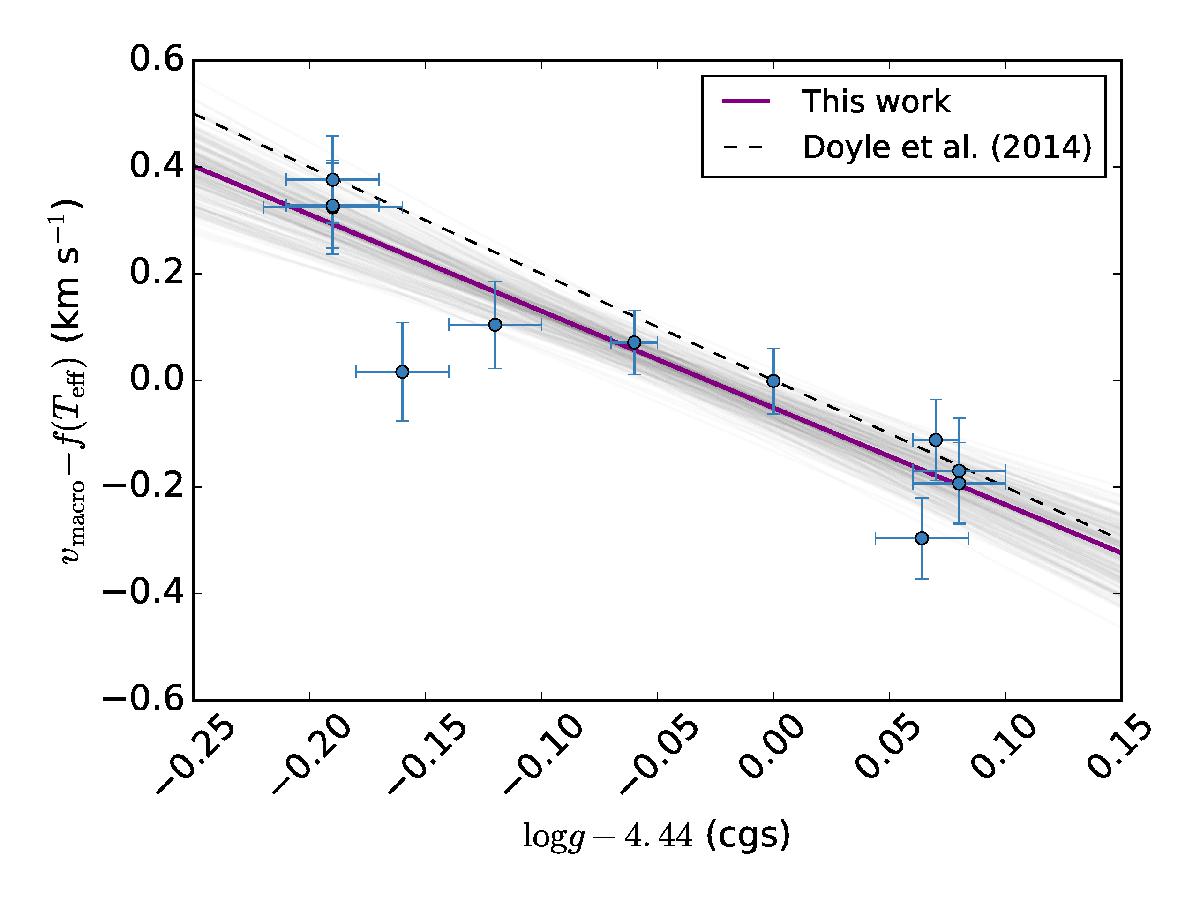
Linear relation between vmacro and log g (a proxy for luminosity) for the stars on Table 2. See the definition of f(Teff) in Sect. 3.1. The orange continuous line represents our determination of a proportionality coefficient of −1.81 and a vertical shift of −0.05 km s-1. The black dashed line is the coefficient found by Doyle et al. (2014). The light gray region is a composition of 200 curves with parameters drawn from a multivariate Gaussian distribution. The Sun is located at the origin.
Current usage metrics show cumulative count of Article Views (full-text article views including HTML views, PDF and ePub downloads, according to the available data) and Abstracts Views on Vision4Press platform.
Data correspond to usage on the plateform after 2015. The current usage metrics is available 48-96 hours after online publication and is updated daily on week days.
Initial download of the metrics may take a while.