Fig. 7
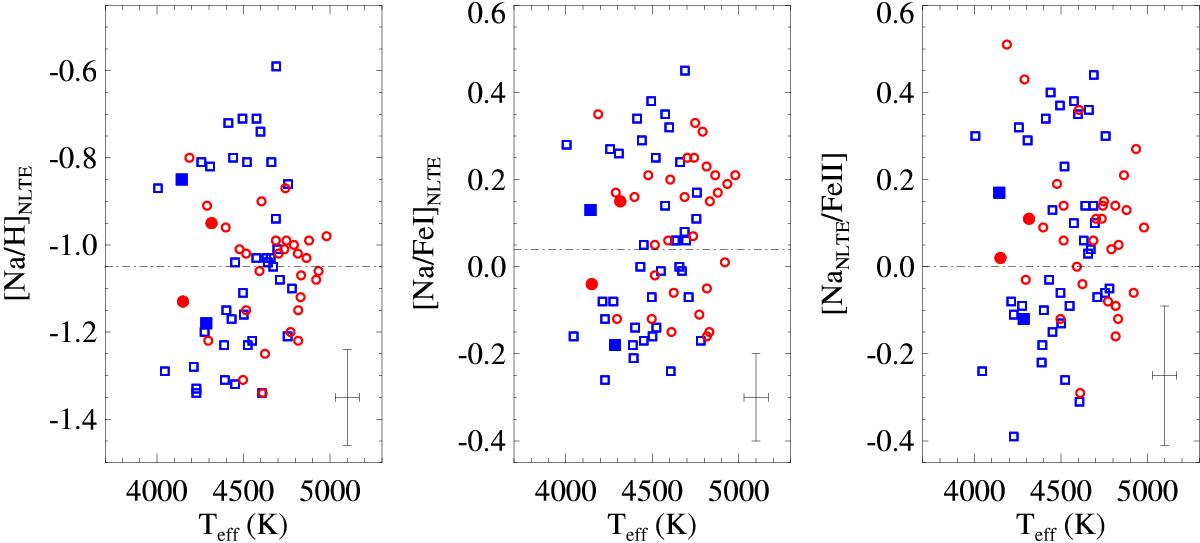
Abundance distributions of our complete (AGB + RGB) sample. Left: [Na/H]NLTE−Teff; middle: [Na/Fe i]NLTE−Teff; right: [NaNLTE/Fe ii]−Teff. Symbols are the same as in Fig. 2. The horizontal dash-dotted lines mark the critical values distinguishing the 1P and 2P stars following Carretta et al. (2009b) criteria (see the text). The typical error bars are shown at the right-bottom corner of each panel (considering the similarity of the errors of the GIRAFFE and UVES samples and the clarity of the figure, we only show the error bars for the GIRAFFE sample which is the largest sample here).
Current usage metrics show cumulative count of Article Views (full-text article views including HTML views, PDF and ePub downloads, according to the available data) and Abstracts Views on Vision4Press platform.
Data correspond to usage on the plateform after 2015. The current usage metrics is available 48-96 hours after online publication and is updated daily on week days.
Initial download of the metrics may take a while.