Fig. 3
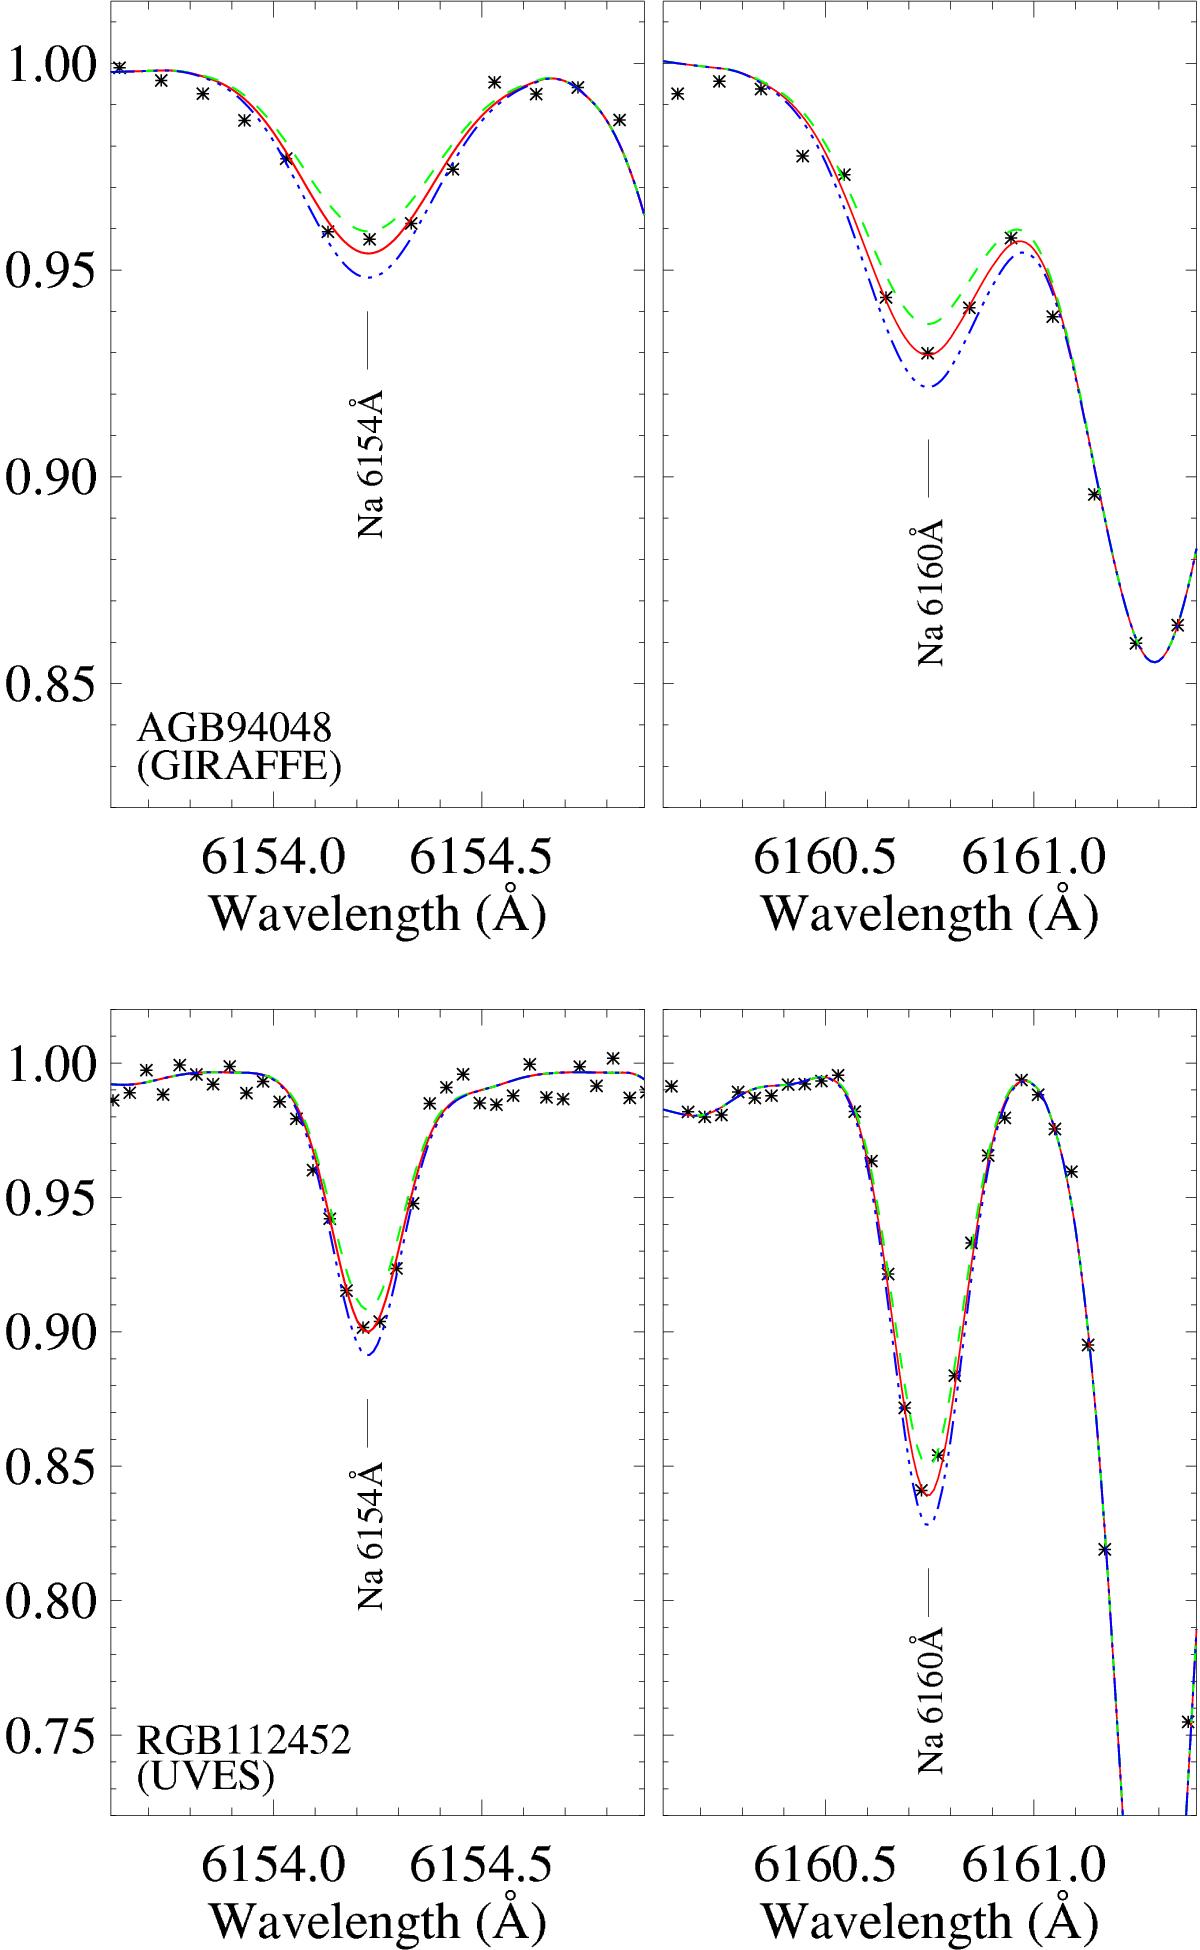
Spectra syntheses of the Na lines region. Top panel: spectra of the GIRAFFE AGB star AGB94048, bottom panel: spectra of the UVES RGB star RGB star RGB112452. The black asterisks represent the observed spectra; the red solid lines are the best-fit synthesised spectra; the blue dash-dotted lines and the green dashed lines are synthesised spectra, but with the best-fit Na abundance changed by plus/minus the error of Na abundance (± 0.07 dex for AGB94048 and ± 0.05 dex for RGB112452; here the error is a combination of random error and fitting error).
Current usage metrics show cumulative count of Article Views (full-text article views including HTML views, PDF and ePub downloads, according to the available data) and Abstracts Views on Vision4Press platform.
Data correspond to usage on the plateform after 2015. The current usage metrics is available 48-96 hours after online publication and is updated daily on week days.
Initial download of the metrics may take a while.