Free Access
Fig. A.2
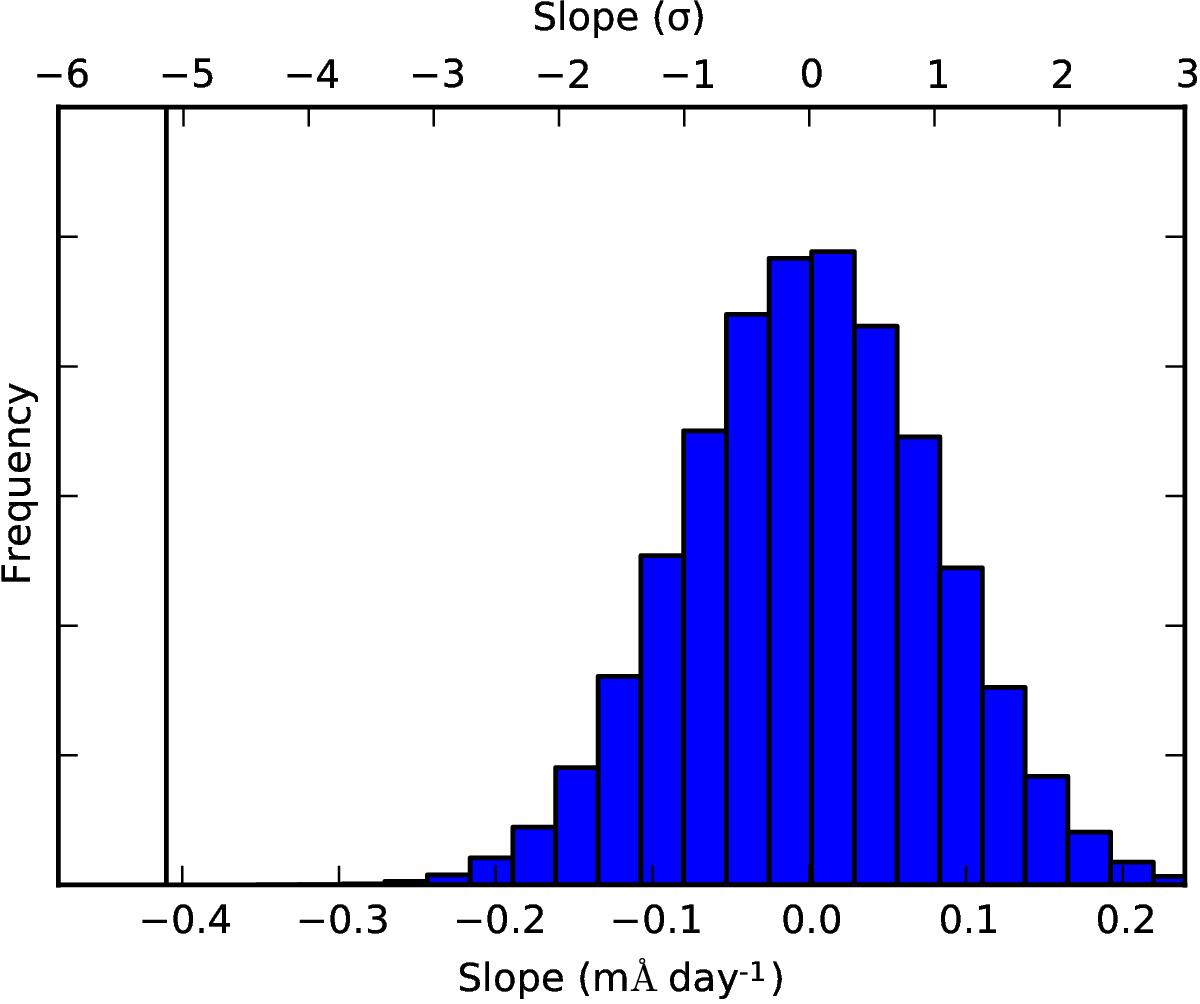
Distribution of slopes obtained by fitting a linear function to the combined equivalent width (D1+D2) values of 105 mock sets of spectra. The solid vertical line indicates the slope of the linear fit to the real data.
Current usage metrics show cumulative count of Article Views (full-text article views including HTML views, PDF and ePub downloads, according to the available data) and Abstracts Views on Vision4Press platform.
Data correspond to usage on the plateform after 2015. The current usage metrics is available 48-96 hours after online publication and is updated daily on week days.
Initial download of the metrics may take a while.