Fig. 10
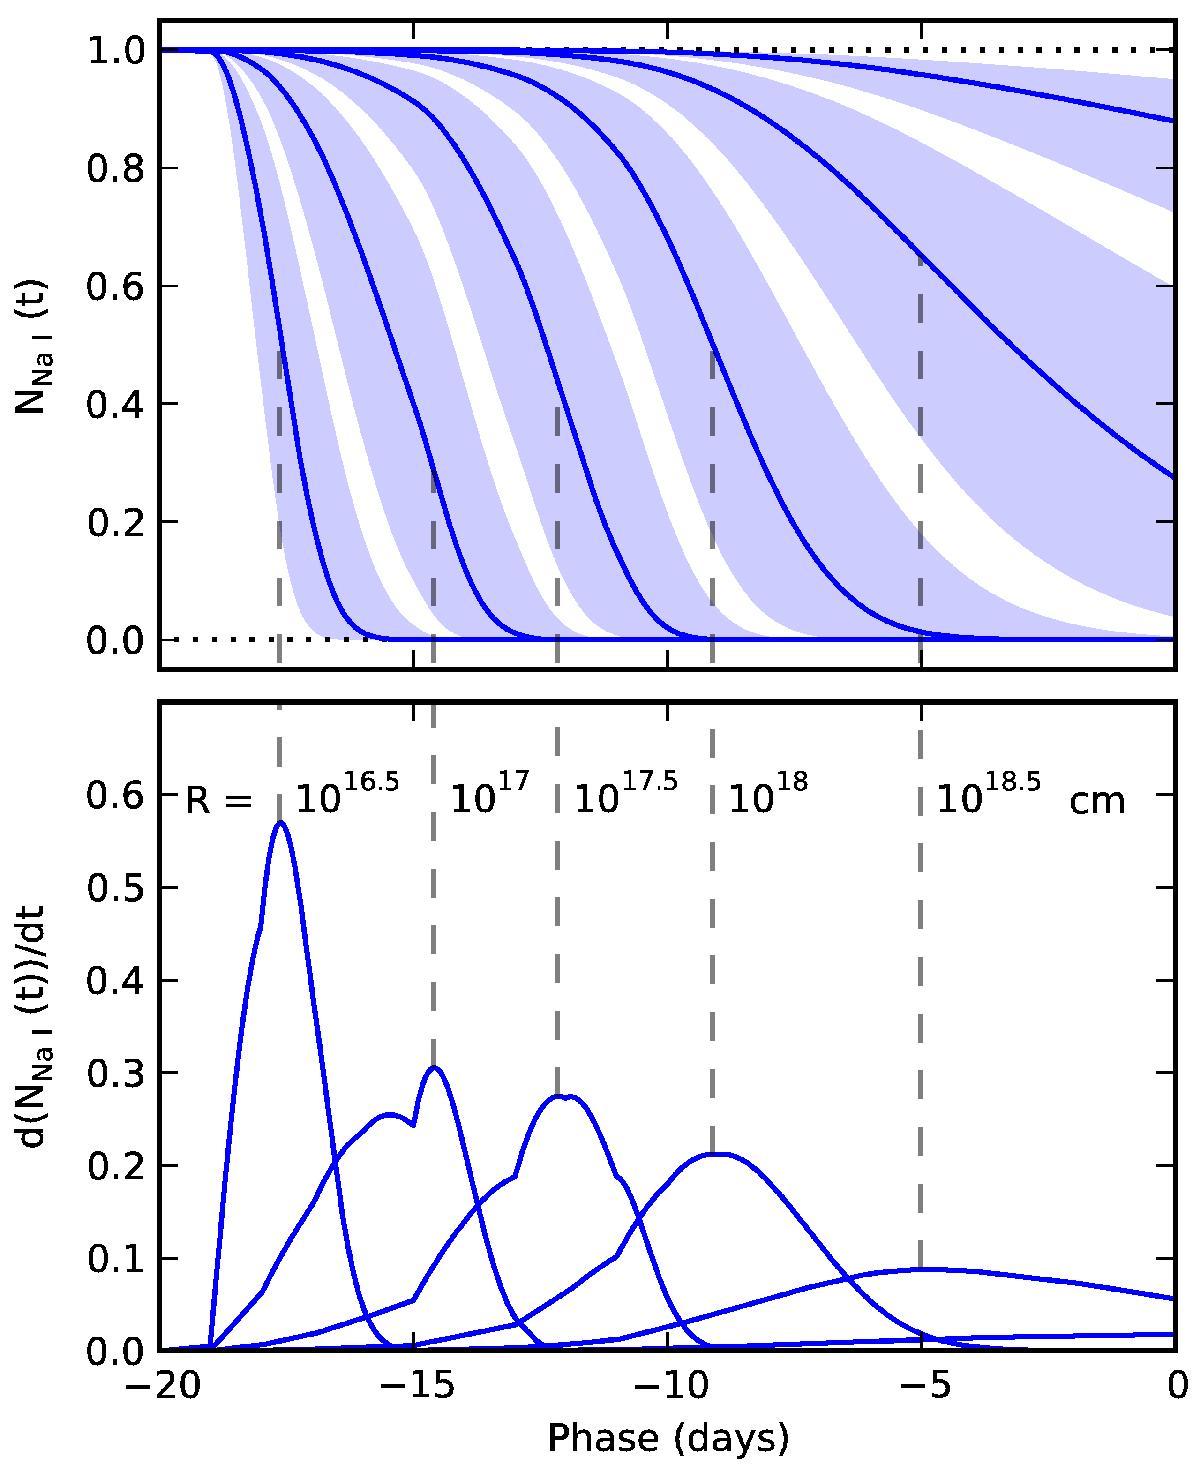
Photoionisation fraction of Na I and rate as a function of phase at distances between 1016.5 and 1018.5 cm from a SN. The dashed vertical lines associate the curves of the two plots with one another and are labeled by their respective radii at which the gas is situated from the explosion. The shaded bands indicate the ± 1 mag change in ionising UV flux from the SN. The Na I gas is assumed to be optically thin and is completely ionised at all radii considered in this plot.
Current usage metrics show cumulative count of Article Views (full-text article views including HTML views, PDF and ePub downloads, according to the available data) and Abstracts Views on Vision4Press platform.
Data correspond to usage on the plateform after 2015. The current usage metrics is available 48-96 hours after online publication and is updated daily on week days.
Initial download of the metrics may take a while.