Fig. 4
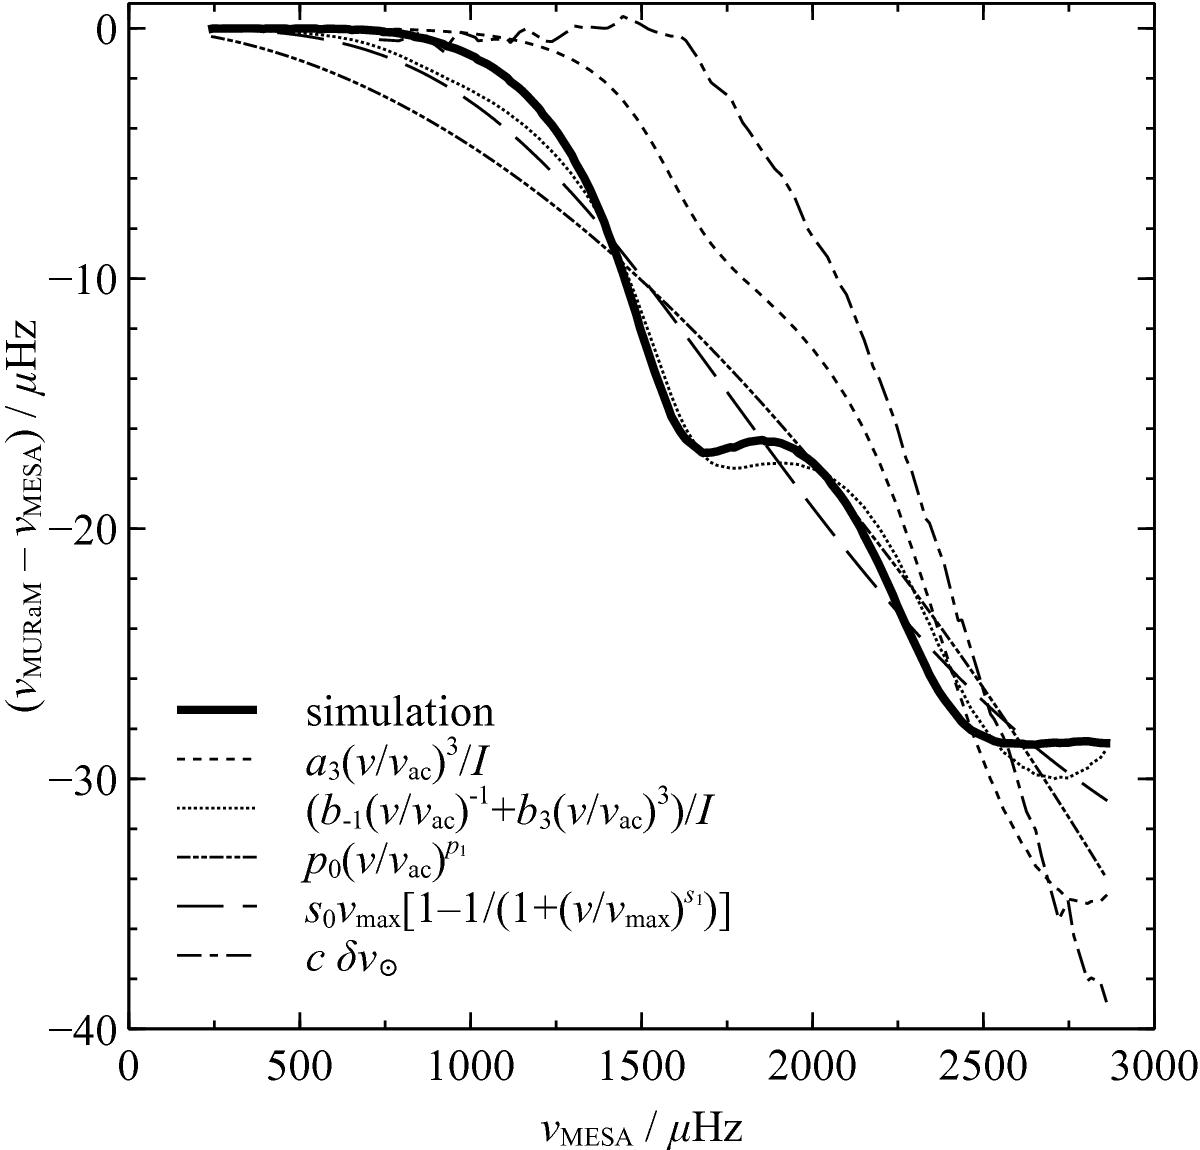
Frequency differences between a stellar model calibrated to the F3 simulation, and the patched model, in which the near-surface layers were replaced by the averaged simulation profile. Additional curves show the parametric fits of the one-term correction by Ball & Gizon (2014; dashed), their two-term fit (dotted), a power law (dot-dot-dashed), the modified Lorentzian of Sonoi et al. (2015; long-dashed), and a scaled solar correction (dot-dashed). The two-term fit is clearly better able to capture the distinct shape of the frequency difference.
Current usage metrics show cumulative count of Article Views (full-text article views including HTML views, PDF and ePub downloads, according to the available data) and Abstracts Views on Vision4Press platform.
Data correspond to usage on the plateform after 2015. The current usage metrics is available 48-96 hours after online publication and is updated daily on week days.
Initial download of the metrics may take a while.