Fig. 3
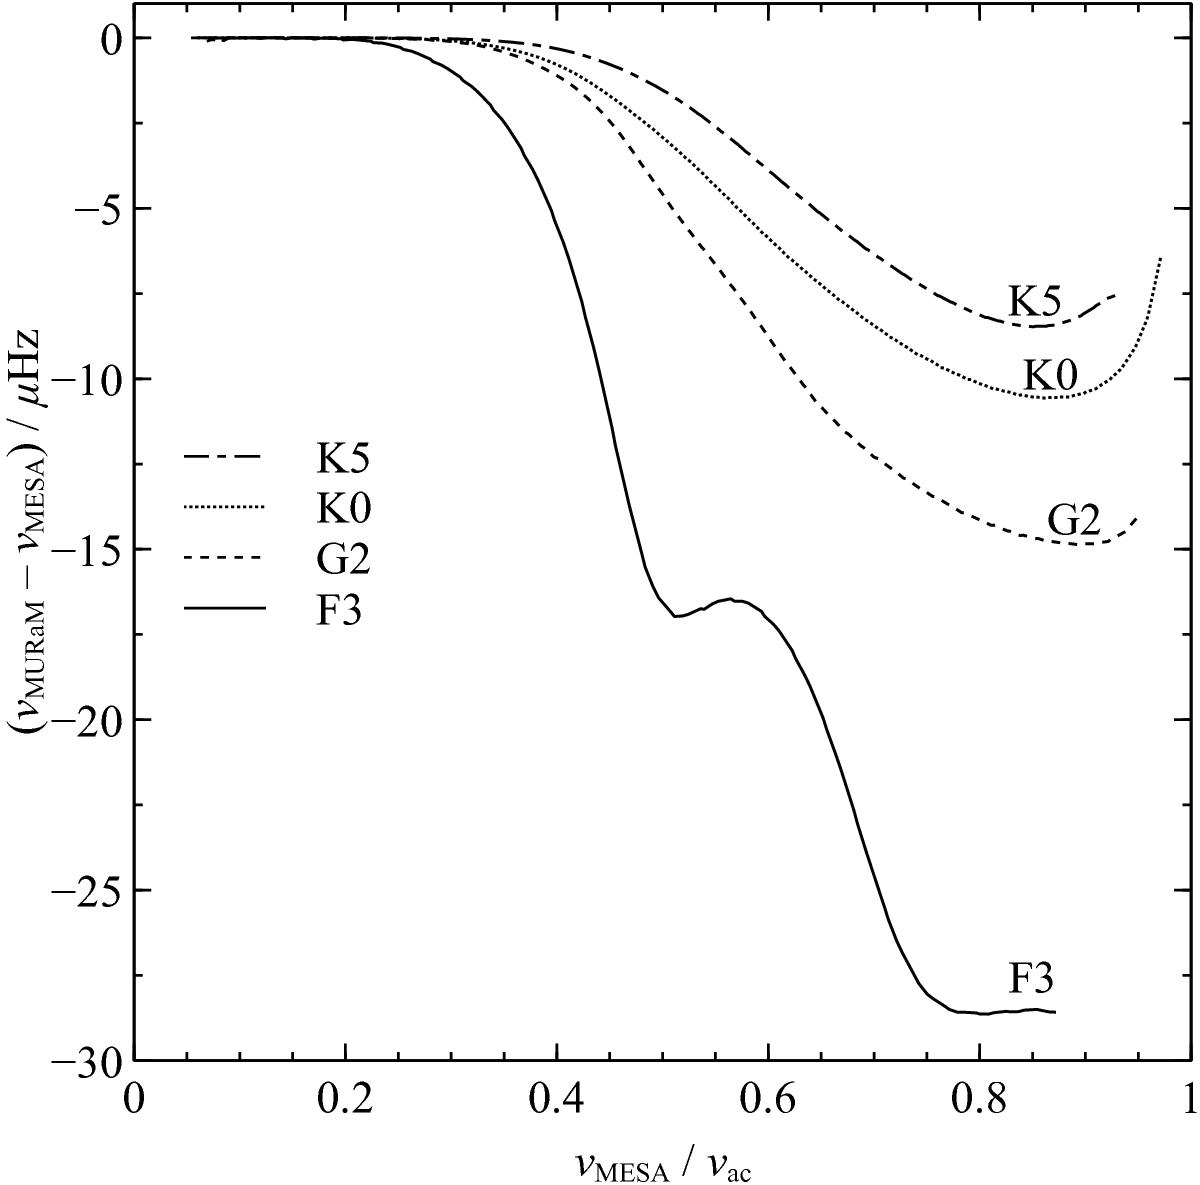
Frequency differences between the stellar models and patched models computed for all four simulations, with the horizontal axis rescaled by the acoustic cut-off frequency νac. The shapes of the frequency differences as a function of frequency are similar for the three cooler simulations (G2, K0 and K5), whereas the difference for the F3 simulation is more complicated.
Current usage metrics show cumulative count of Article Views (full-text article views including HTML views, PDF and ePub downloads, according to the available data) and Abstracts Views on Vision4Press platform.
Data correspond to usage on the plateform after 2015. The current usage metrics is available 48-96 hours after online publication and is updated daily on week days.
Initial download of the metrics may take a while.