Fig. 1
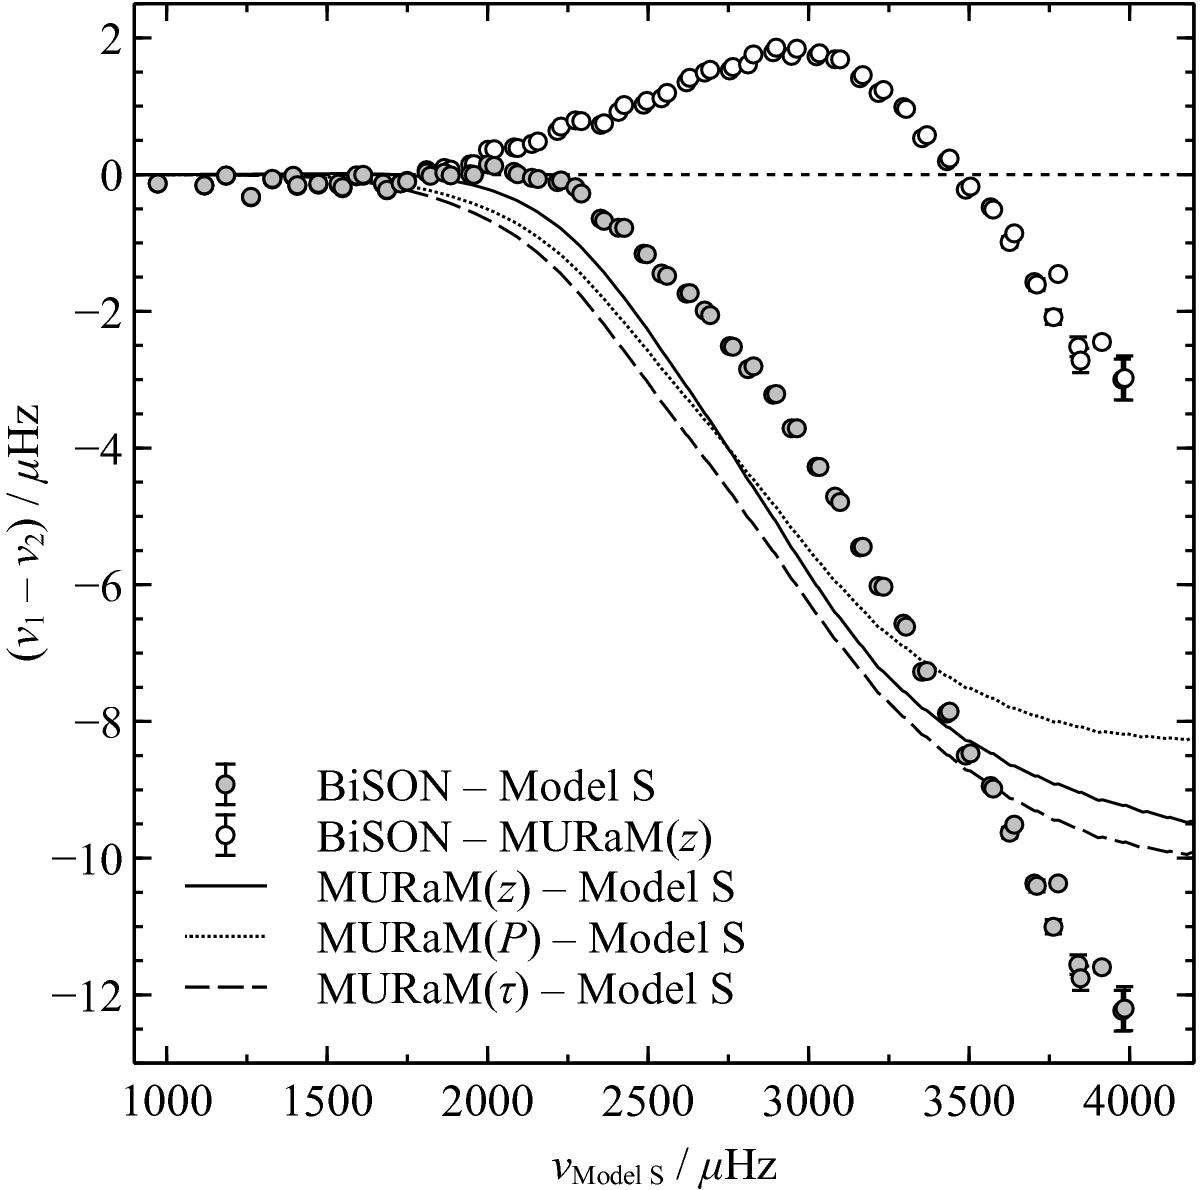
Frequency differences between BiSON observations of low-degree solar oscillations and Model S before (grey points) and after (white points) the near-surface layers are replaced by the profile of the G2-type MURaM simulation averaged over time and surfaces of constant geometric depth. The solid line shows the difference between the frequencies before and after replacing the near-surface layers. In addition, the dotted and dashed lines show the frequency differences when the MURaM simulation is instead averaged over surfaces of constant pressure P or optical depth τ. With the averaged MURaM profile, the residual frequency difference is reduced to at most about 3 μHz. The frequency changes are sensitive to the averaging method at about the 1 μHz level, which is smaller than the surface effect itself.
Current usage metrics show cumulative count of Article Views (full-text article views including HTML views, PDF and ePub downloads, according to the available data) and Abstracts Views on Vision4Press platform.
Data correspond to usage on the plateform after 2015. The current usage metrics is available 48-96 hours after online publication and is updated daily on week days.
Initial download of the metrics may take a while.