Fig. 7
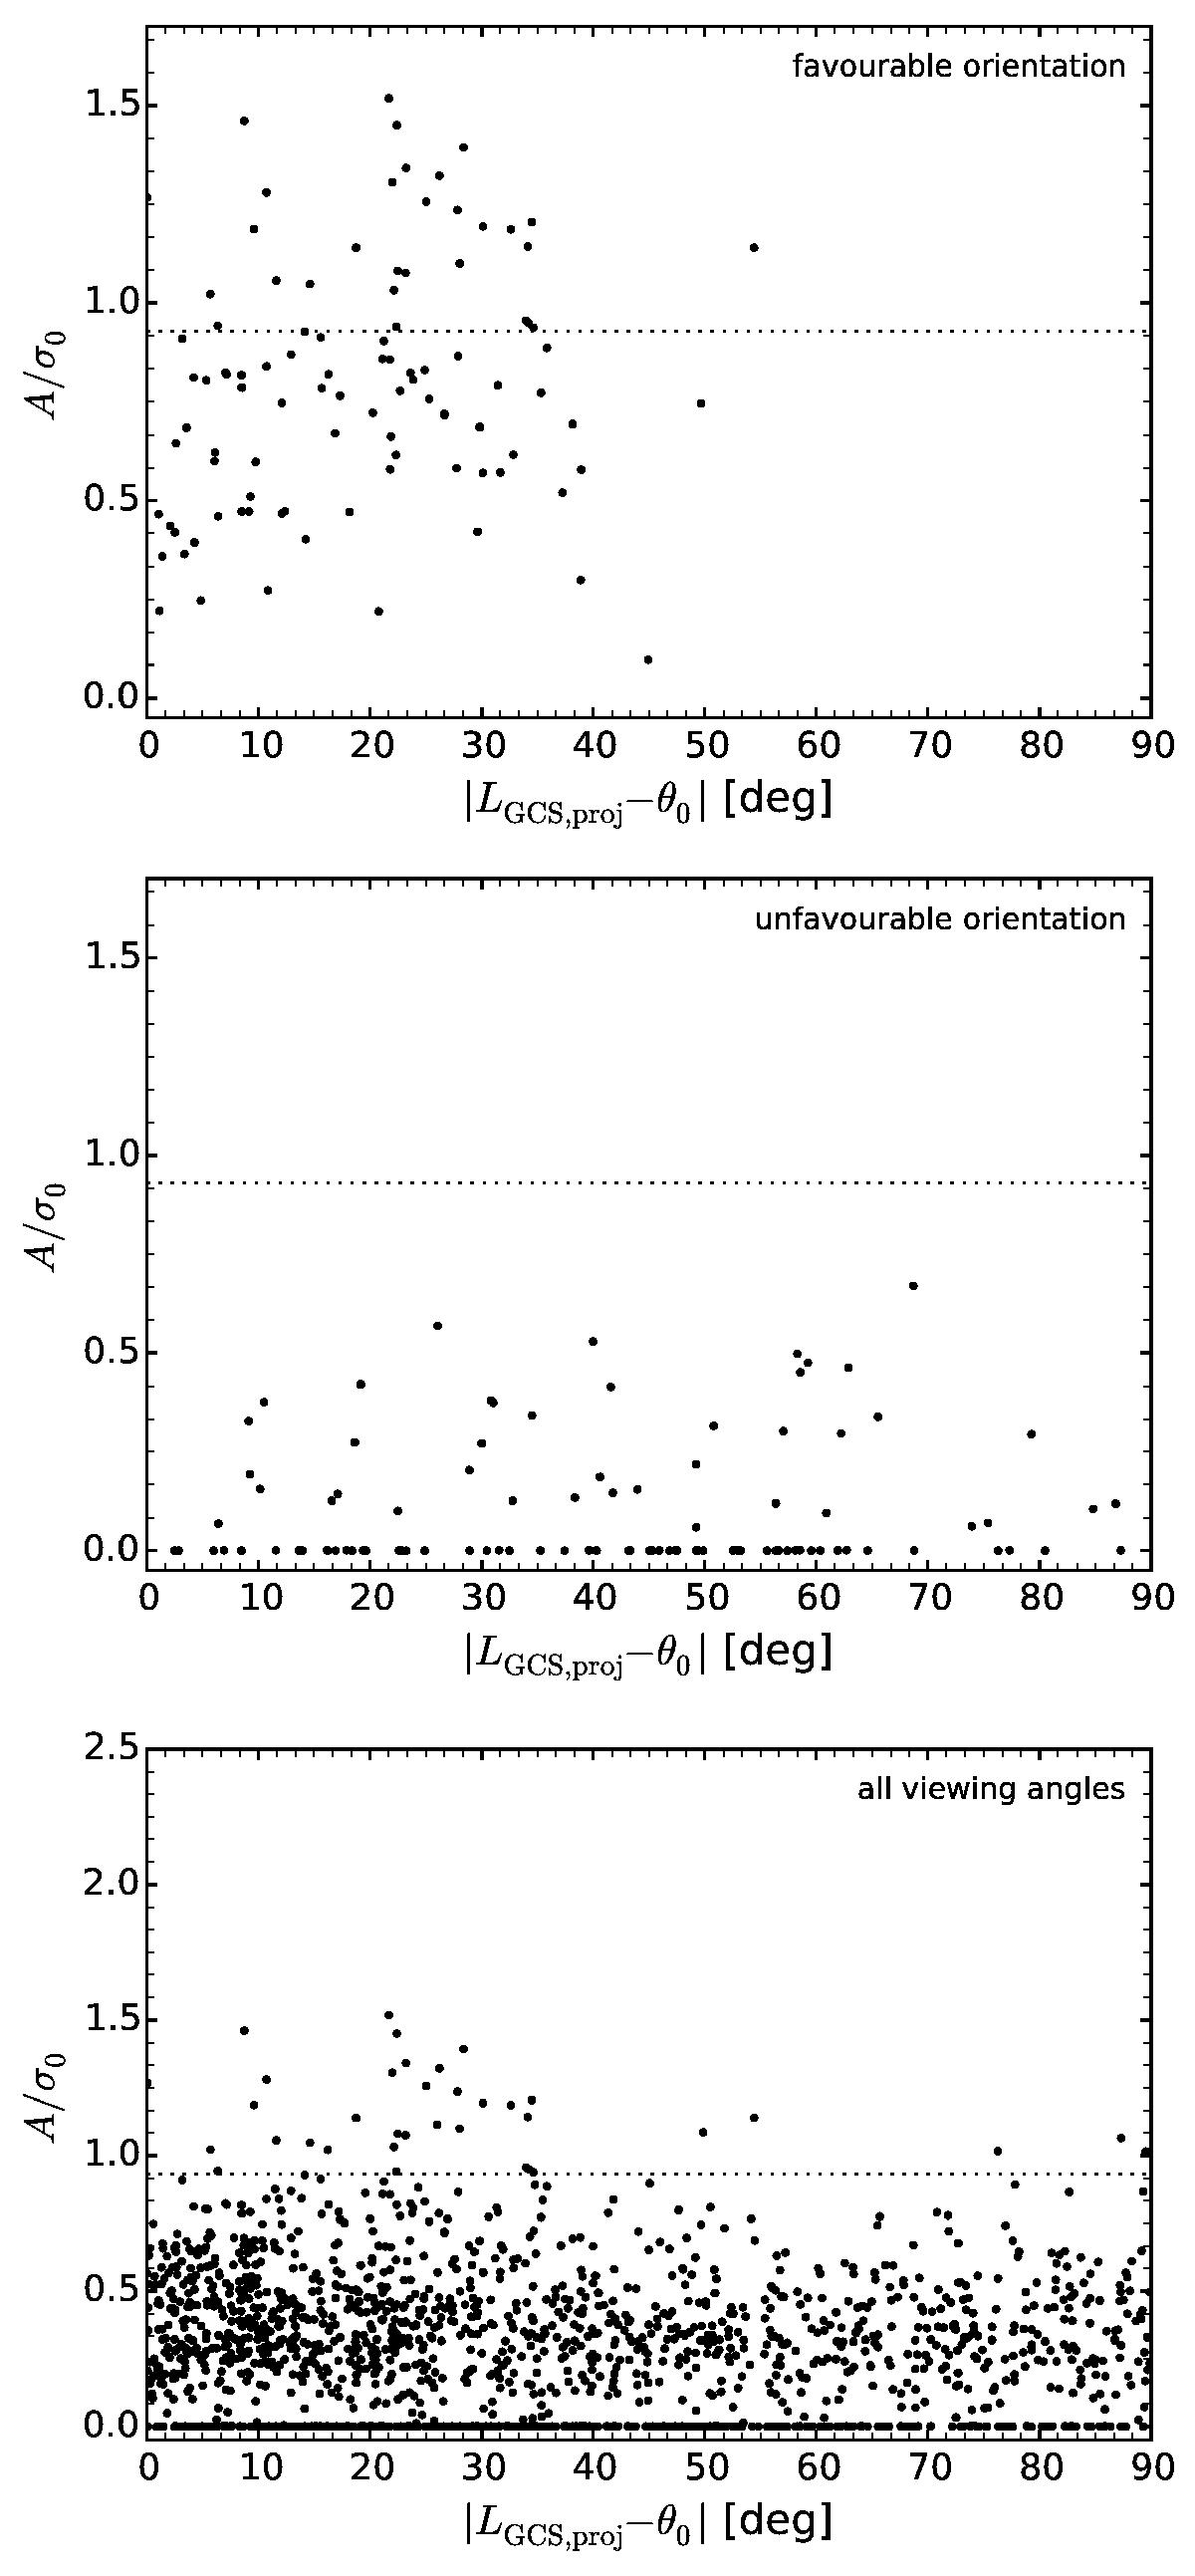
Kinematic ratio of the mock GC systems in the outer halo of Aq-A versus the difference between the position angle of their angular momentum projected on the plane of the sky and the position angle of the rotation axis as determined by our kinematic analysis. The top panel shows the systems seen from an observer located at (θ,φ) = (0,0) who detects the maximum rotation signal, and the middle panel shows the systems seen by an observer located at (θ,φ) = (135,0) who detects no such structured motion. The bottom panel displays all systems regardless of the viewing perspective. We note that the projected angular momentum and rotation axis agree well for systems that exhibit a high degree of rotation.
Current usage metrics show cumulative count of Article Views (full-text article views including HTML views, PDF and ePub downloads, according to the available data) and Abstracts Views on Vision4Press platform.
Data correspond to usage on the plateform after 2015. The current usage metrics is available 48-96 hours after online publication and is updated daily on week days.
Initial download of the metrics may take a while.