Fig. 5
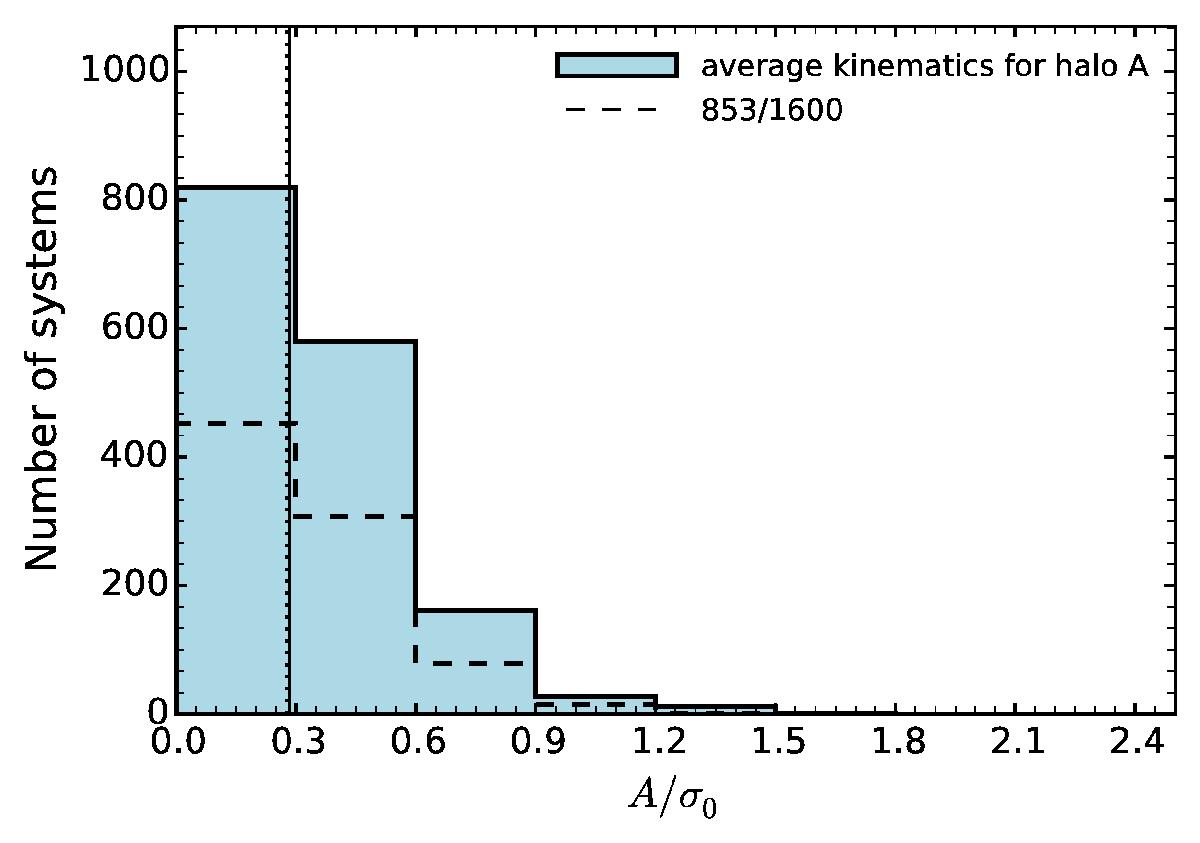
Kinematic ratio A/σ0 for all generated mock GC systems in the halo of Aq-A, regardless of viewing angle. The dashed histogram shows the subsample of systems that have similar azimuthal distributions to the halo GC system of M 31 (see text for details). The solid and dashed vertical lines represent the mean kinematic ratio measured for all systems and for the azimuthally selected subsample of systems, respectively.
Current usage metrics show cumulative count of Article Views (full-text article views including HTML views, PDF and ePub downloads, according to the available data) and Abstracts Views on Vision4Press platform.
Data correspond to usage on the plateform after 2015. The current usage metrics is available 48-96 hours after online publication and is updated daily on week days.
Initial download of the metrics may take a while.