Fig. 3
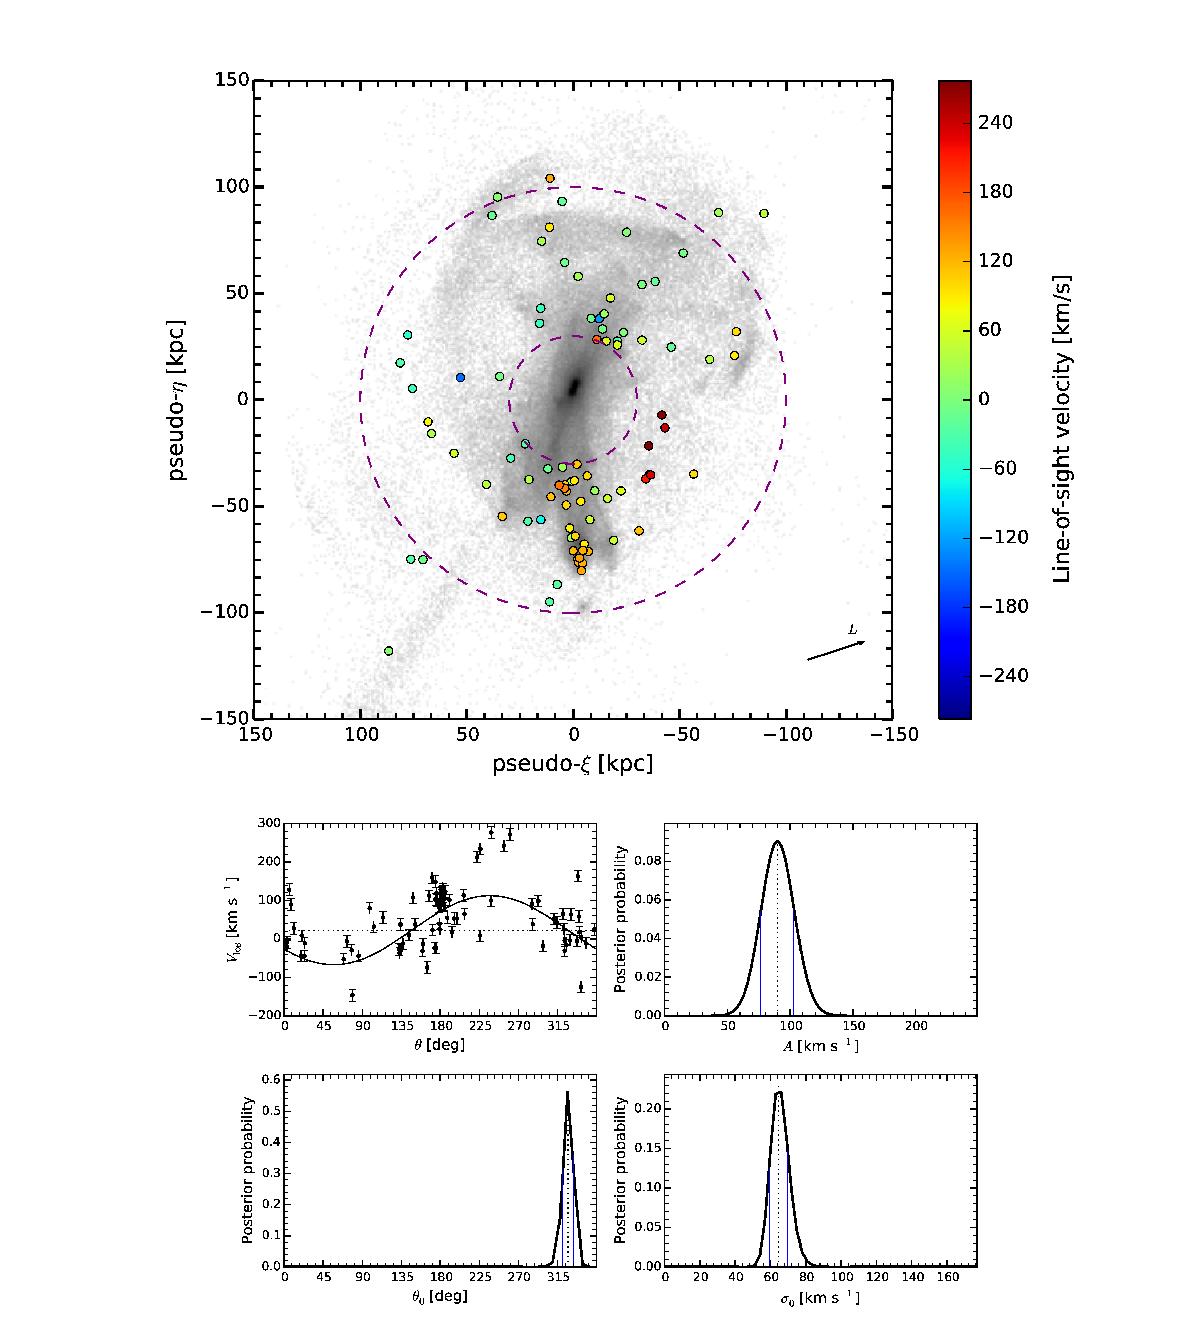
Top panel: highly rotating (A/σ0 = 1.38) mock GC system around Aq-A, observed from perspective (θ,φ) = (0,0). The colours of the points marking the positions of the GCs correspond to their radial velocity as seen by the virtual observer. The arrow in the bottom right corner of the map indicates the orientation of the angular momentum of the stellar halo as seen on the plane of the sky. Four diagnostic plots are displayed below each of the two maps. The top left shows the line-of-sight velocities of the GCs as a function of their position angle. The best fit rotation curve is fitted through the plots according to Eq. (1). The horizontal dashed line represents the systemic velocity of the halo. The remaining three plots (moving clockwise) display the posterior probability distribution functions for the amplitude, velocity dispersion, and rotation axis of the mock GC system as determined by our Bayesian machinery. The peak of each distribution and the 1−σ uncertainties are indicated by the dashed and solid vertical lines, respectively.

Current usage metrics show cumulative count of Article Views (full-text article views including HTML views, PDF and ePub downloads, according to the available data) and Abstracts Views on Vision4Press platform.
Data correspond to usage on the plateform after 2015. The current usage metrics is available 48-96 hours after online publication and is updated daily on week days.
Initial download of the metrics may take a while.