Fig. 2
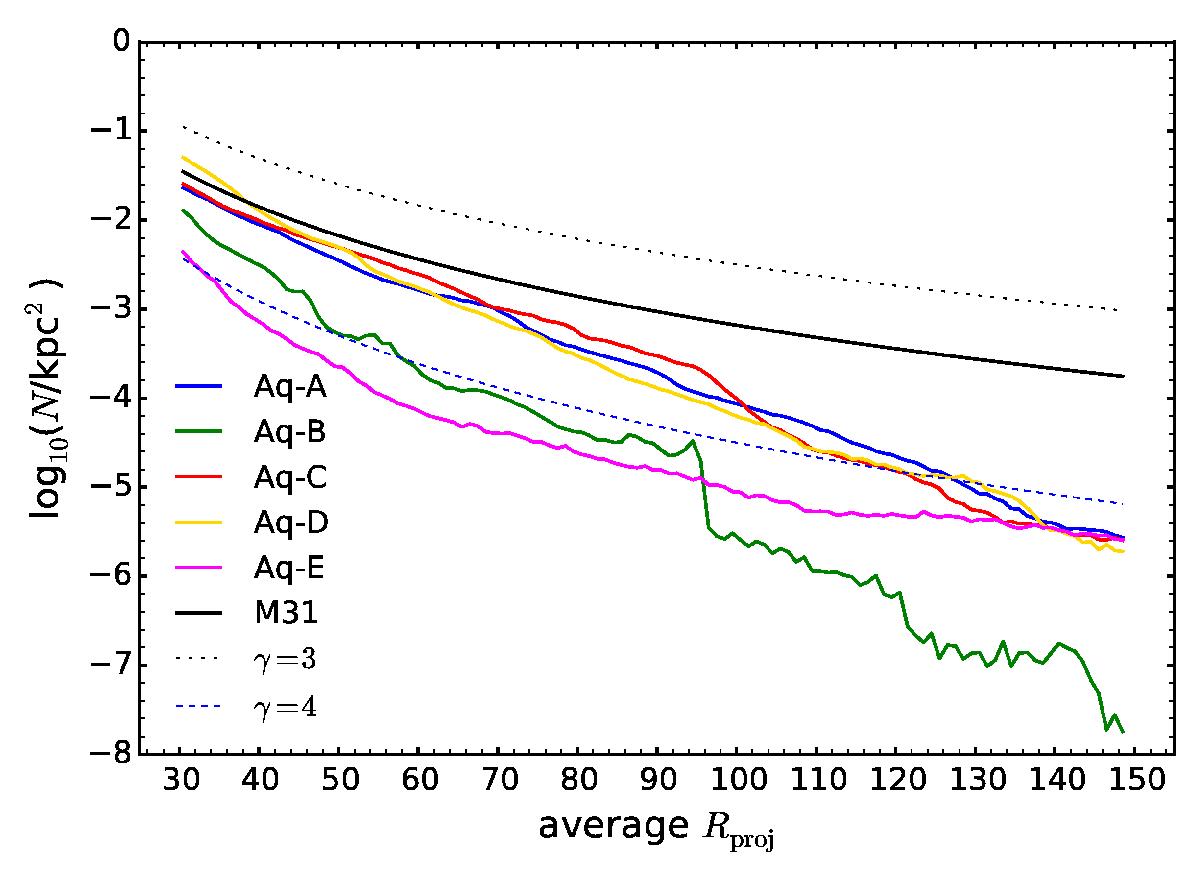
Coloured lines represent the average stellar radial number density profiles of each of the five Aquarius halos considered, as seen by 16 observers, 3 of whom are located along the principal axis of the respective dark matter halo, while the rest are arranged in a regular pattern spanning one hemisphere centred on the target galaxy (see text for details). The black line shows the stellar radial profile of metal-poor stars in the halo of M 31, represented by a power law with index of − 3.34 (Ibata et al. 2014). For reference, two generic power laws having indices of − 3 and − 4 are plotted with dashed lines.
Current usage metrics show cumulative count of Article Views (full-text article views including HTML views, PDF and ePub downloads, according to the available data) and Abstracts Views on Vision4Press platform.
Data correspond to usage on the plateform after 2015. The current usage metrics is available 48-96 hours after online publication and is updated daily on week days.
Initial download of the metrics may take a while.