Fig. 1
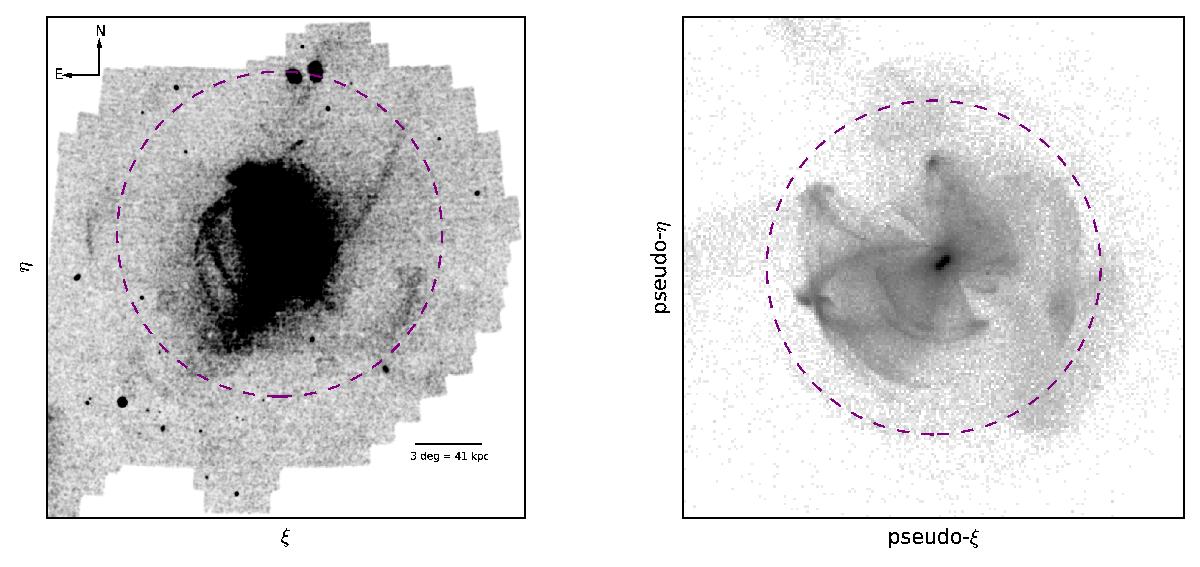
Left panel: metal-poor ([Fe/H] ≲−1.4) stellar density map of M 31 in standard tangential coordinates. Right panel: equivalent stellar halo of the simulated Aq-C, seen from 1 Mpc away. The displayed region is 300 × 300 kpc wide. To give a better sense of scale, a dashed purple circle with a radius of 100 kpc is drawn in both panels. Similar debris resulting from accretion events are easily seen in the halos of both M 31 and Aq-C. In the real and the simulated galaxy, the accreting substructures have anisotropic distributions on the sky. We note that the entire Aq-C stellar halo is built from accreted material since the simulations contain no in situ components.
Current usage metrics show cumulative count of Article Views (full-text article views including HTML views, PDF and ePub downloads, according to the available data) and Abstracts Views on Vision4Press platform.
Data correspond to usage on the plateform after 2015. The current usage metrics is available 48-96 hours after online publication and is updated daily on week days.
Initial download of the metrics may take a while.