Fig. 6
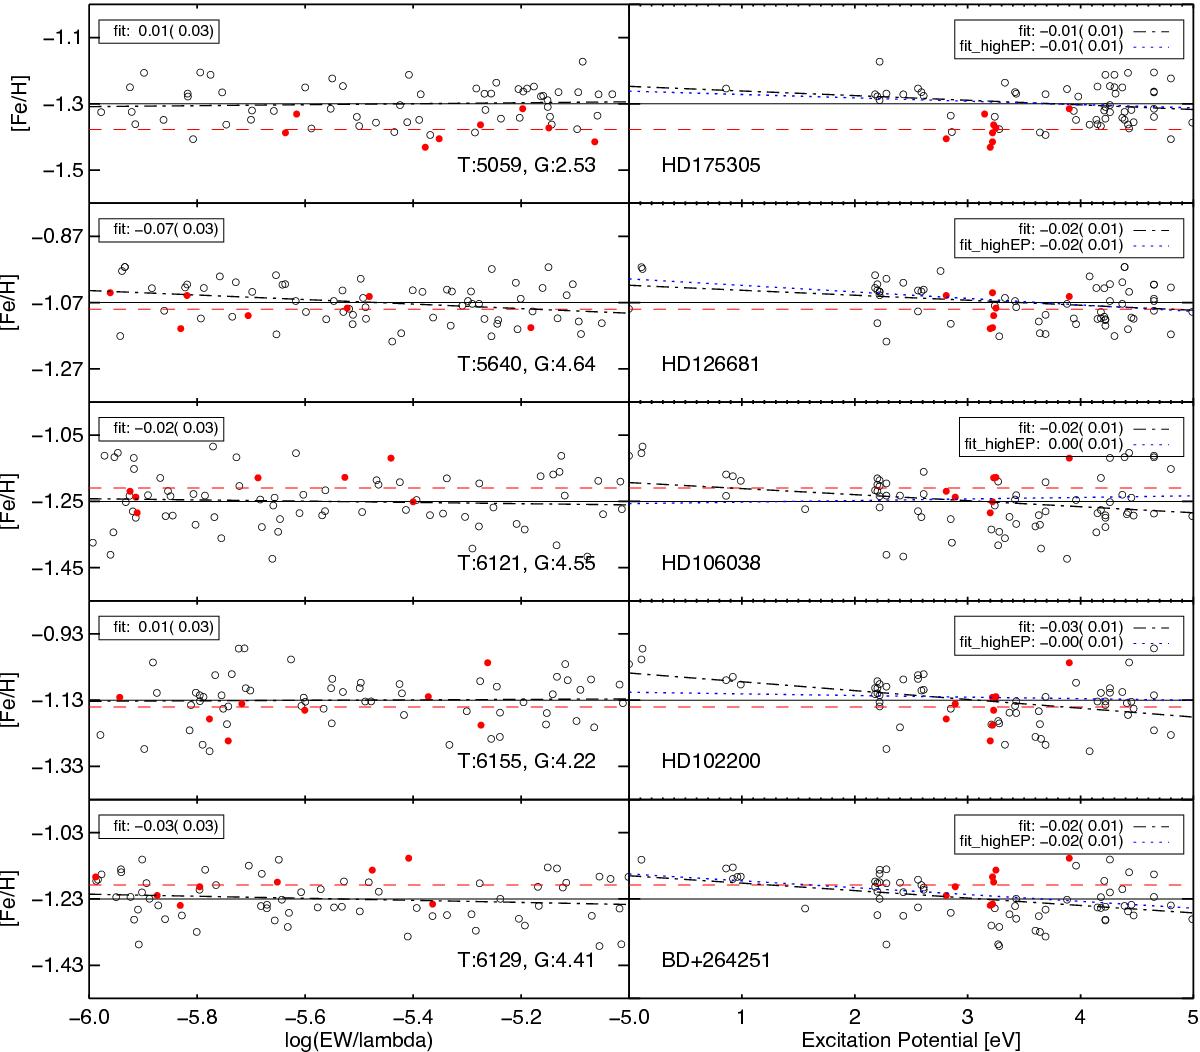
Final iron abundances as a function of REW (left panels) and EP (right panels) for five stars (BD+264251, HD 102200, HD 106038, HD 126681, HD 175305) analysed in this work. Open circles indicate neutral lines while filled red circles indicated ionised lines. A linear regression fit to the neutral lines is performed for all lines (indicated with a black dash-dotted line) and for high-EP lines (EP ≥ 2 eV, indicated by a blue dotted line). The slope of the trend and its standard error are indicated at the top of each panel. A slope is considered to be significant if its absolute value is larger than the standard error. The effective temperature and surface gravity for each star is also indicated at the bottom of the left panels for reference. Dashed red line indicates the mean of the ionised lines.
Current usage metrics show cumulative count of Article Views (full-text article views including HTML views, PDF and ePub downloads, according to the available data) and Abstracts Views on Vision4Press platform.
Data correspond to usage on the plateform after 2015. The current usage metrics is available 48-96 hours after online publication and is updated daily on week days.
Initial download of the metrics may take a while.