Fig. A.1
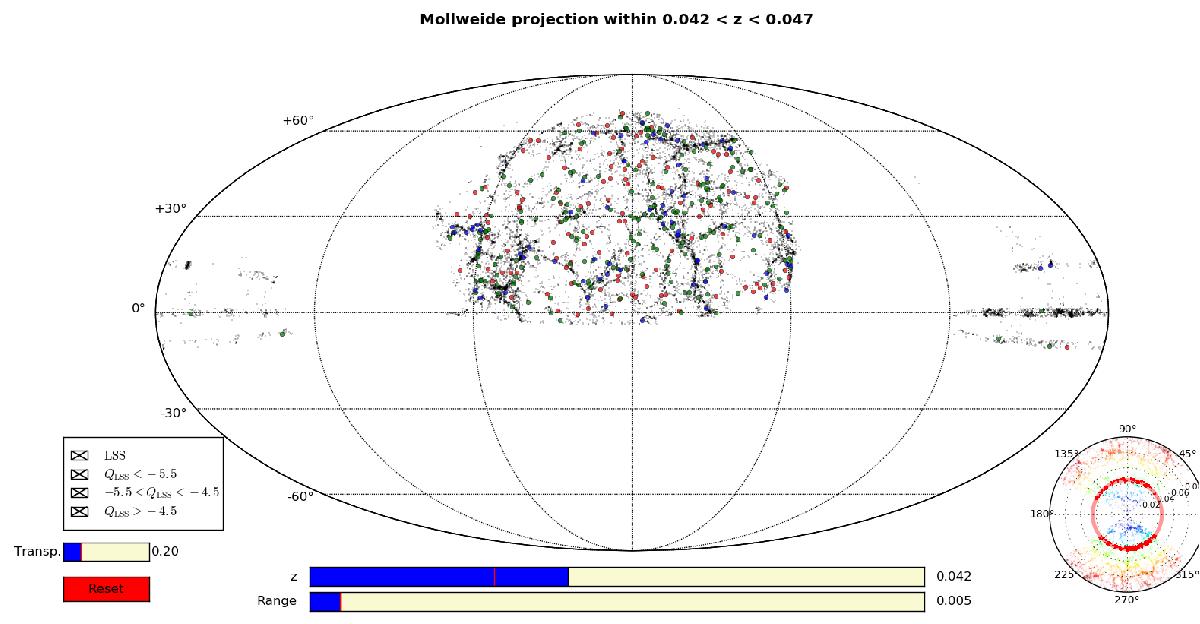
Interactive 3D visualisation software: Mollweide projection. Mollweide projection of the LSS for galaxies (black points) in the redshift range 0.042 < z < 0.047 as shown in the blue bars in the lower part of the figure. Red disks represent SIG galaxies with QLSS ≤ −5.5 within the same redshift range. Green disks represent SIG galaxies with −5.5 <QLSS ≤ −4.5 within the same redshift range. Blue disks represent SIG galaxies with QLSS > −4.5 within the same redshift range. To guide the eye, a wedge diagram, for LSS galaxies within –2 and 2 degrees in declination, is shown in the right lower part of the figure. Colour coded according to the redshift from z = 0 (blue) to z = 0.10 (red). The red ring in the polar representation corresponds to the selected redshift range in the central Mollweide projection.
Current usage metrics show cumulative count of Article Views (full-text article views including HTML views, PDF and ePub downloads, according to the available data) and Abstracts Views on Vision4Press platform.
Data correspond to usage on the plateform after 2015. The current usage metrics is available 48-96 hours after online publication and is updated daily on week days.
Initial download of the metrics may take a while.