Fig. 6
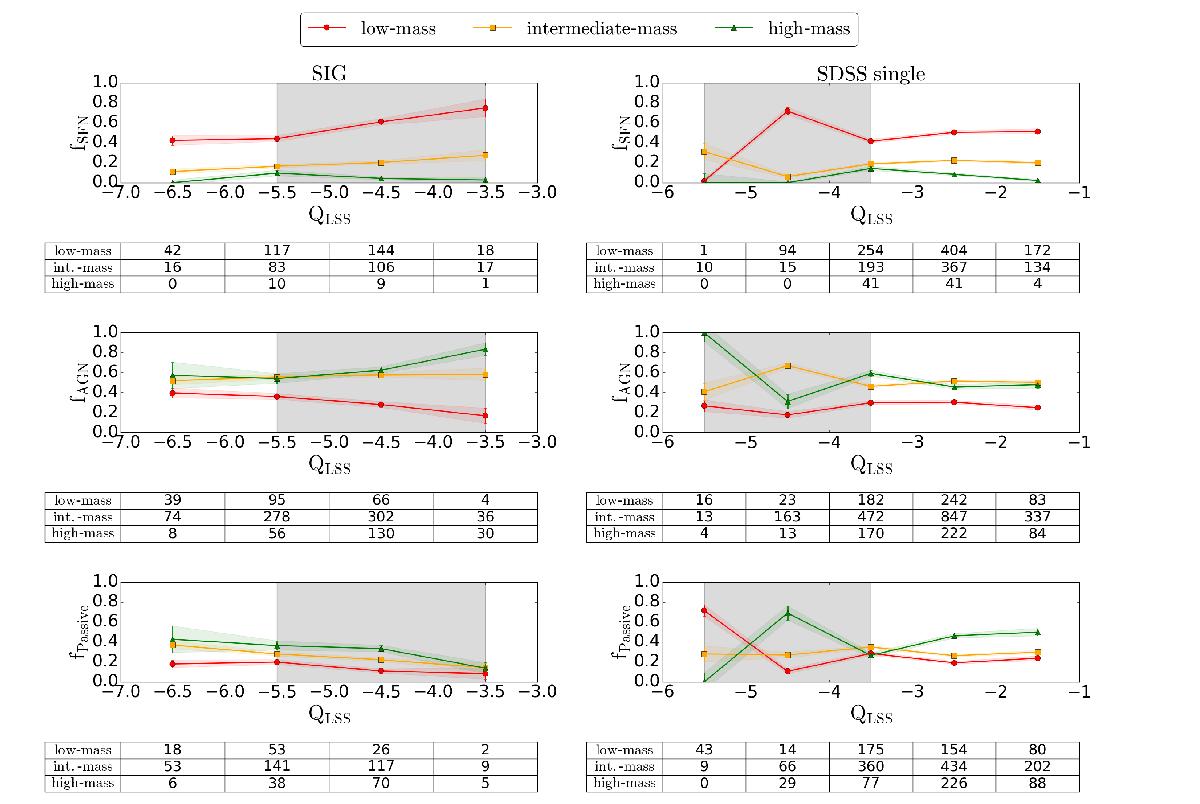
Fraction of optical nuclear activity with respect to the QLSS environmental parameter. Low-mass galaxies (10.0 ≤ log (M⋆) < 10.5 [M⊙]) are represented by red circles, intermediate-mass galaxies (10.5 ≤ log (M⋆) < 11.0 [M⊙]) are represented by orange squares, and high-mass galaxies (11.0 ≤ log (M⋆) ≤ 11.4 [M⊙]) are represented by green triangles. The fractions of SFN, optical AGN, and passive SIG galaxies (NT = 587, 1153, and 559, respectively) are represented from top to bottom in the left panels, and for SDSS single galaxies (NT = 1777, 3027, and 2063, respectively) in the right panels. The number of galaxies in each QLSS bin is shown in tables for each sample at the bottom of each panel. The dashed area in the figures corresponds to the range with common values of QLSS between the two samples, from –5.5 to –3.5. Error bars are given considering binomial distribution.
Current usage metrics show cumulative count of Article Views (full-text article views including HTML views, PDF and ePub downloads, according to the available data) and Abstracts Views on Vision4Press platform.
Data correspond to usage on the plateform after 2015. The current usage metrics is available 48-96 hours after online publication and is updated daily on week days.
Initial download of the metrics may take a while.