Fig. 4
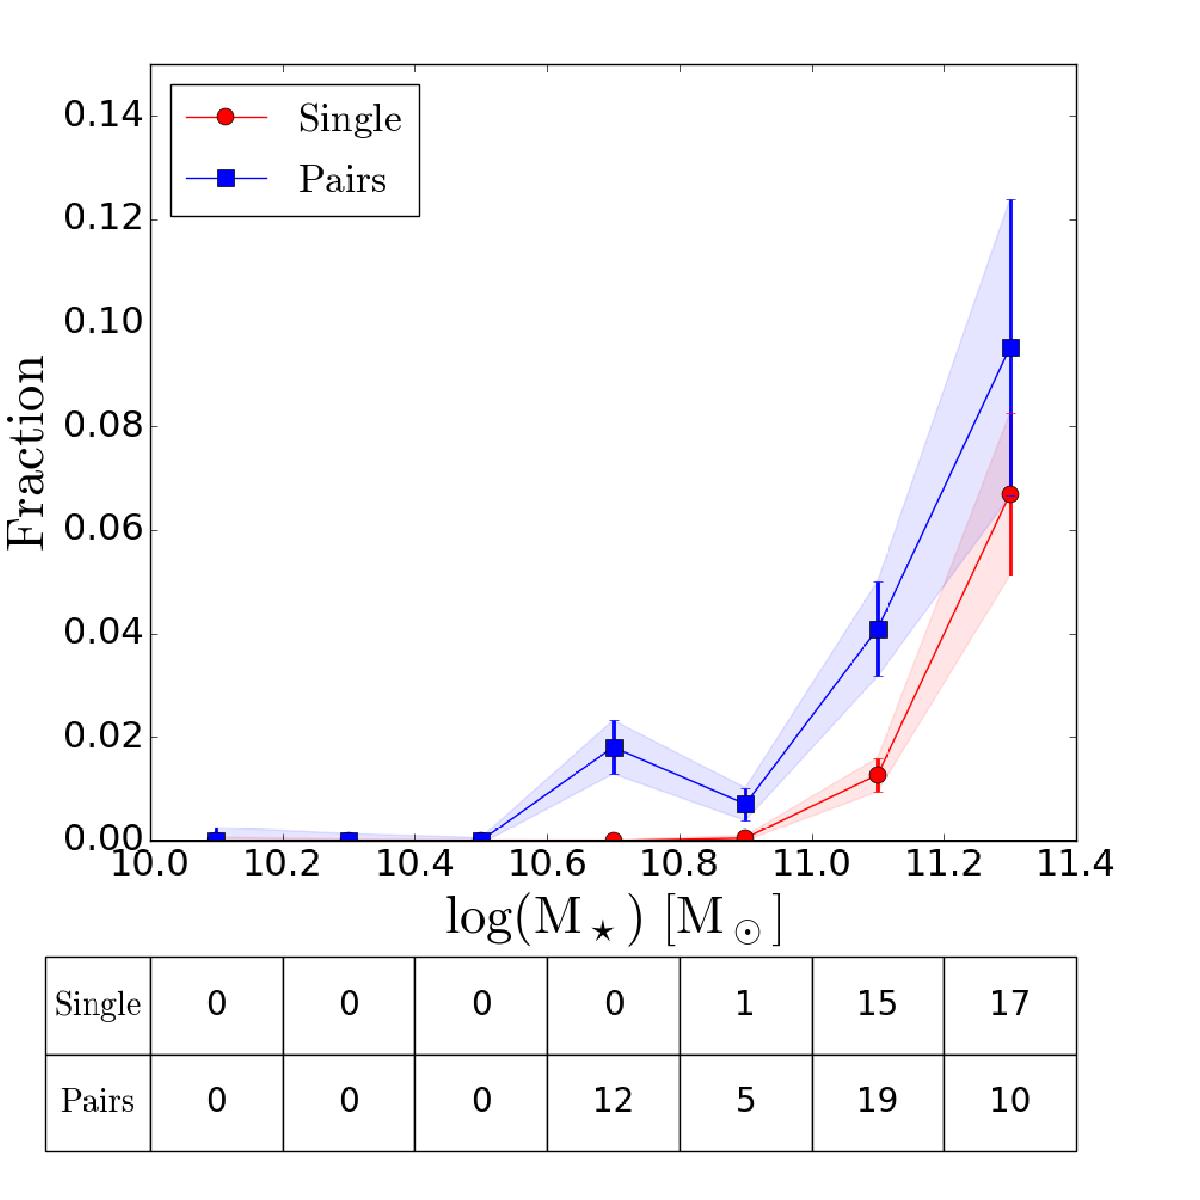
Fraction of radio AGN (LERG) with respect to stellar mass. Red circles represent the joined sample of SIG and SDSS single galaxies (NT = 33), and blue squares represent the sample of galaxies in pairs, composed of SIP and SDSS pairs (NT = 45). The number of galaxies in each stellar mass bin is shown in the table at the bottom. Error bars are given considering binomial distribution.
Current usage metrics show cumulative count of Article Views (full-text article views including HTML views, PDF and ePub downloads, according to the available data) and Abstracts Views on Vision4Press platform.
Data correspond to usage on the plateform after 2015. The current usage metrics is available 48-96 hours after online publication and is updated daily on week days.
Initial download of the metrics may take a while.