Fig. 2
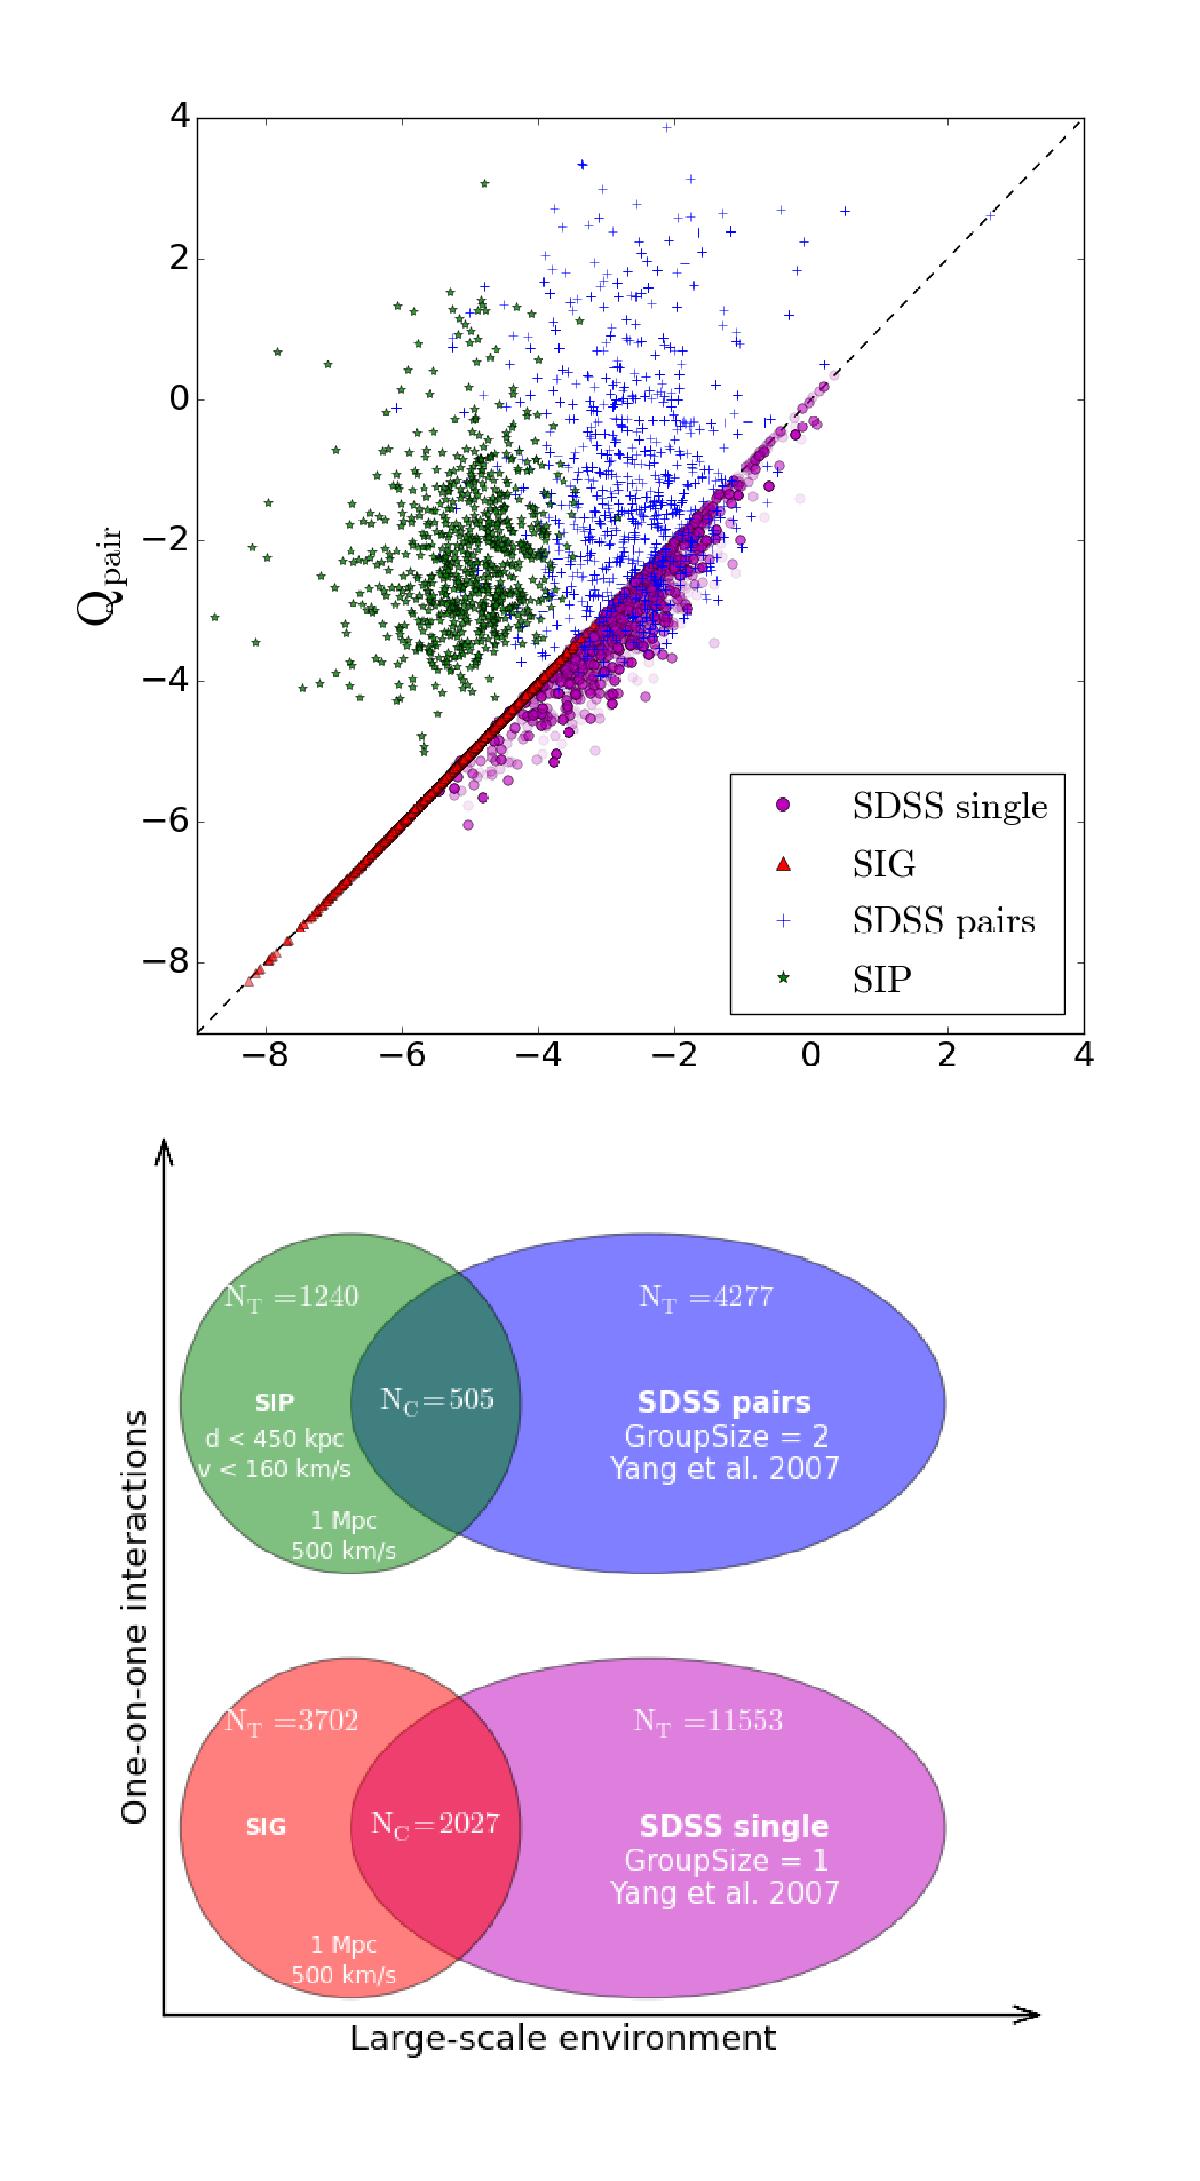
Upper panel: comparison of Qpair vs. QLSS, isolated pairs (green stars), SDSS single galaxies (magenta circles), and SDSS pairs (blue pluses). For isolated galaxies (red triangles) there is not Qpair available, but we consider Qpair = QLSS for comparison purposes. The black dashed line represents the line where Qpair = QLSS. Lower panel: schema of the sample definition, total number of galaxies (NT) in each sample and number of galaxies in common (NC), and environment definition for the SIG and SIP samples (red and green circles, respectively), and for control samples (blue and magenta ellipses for SDSS pairs and SDSS singles, respectively). The arrows in the axis indicate the direction to higher values of the tidal strength.
Current usage metrics show cumulative count of Article Views (full-text article views including HTML views, PDF and ePub downloads, according to the available data) and Abstracts Views on Vision4Press platform.
Data correspond to usage on the plateform after 2015. The current usage metrics is available 48-96 hours after online publication and is updated daily on week days.
Initial download of the metrics may take a while.