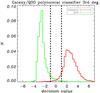
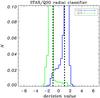
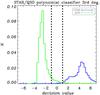
Fig. 8
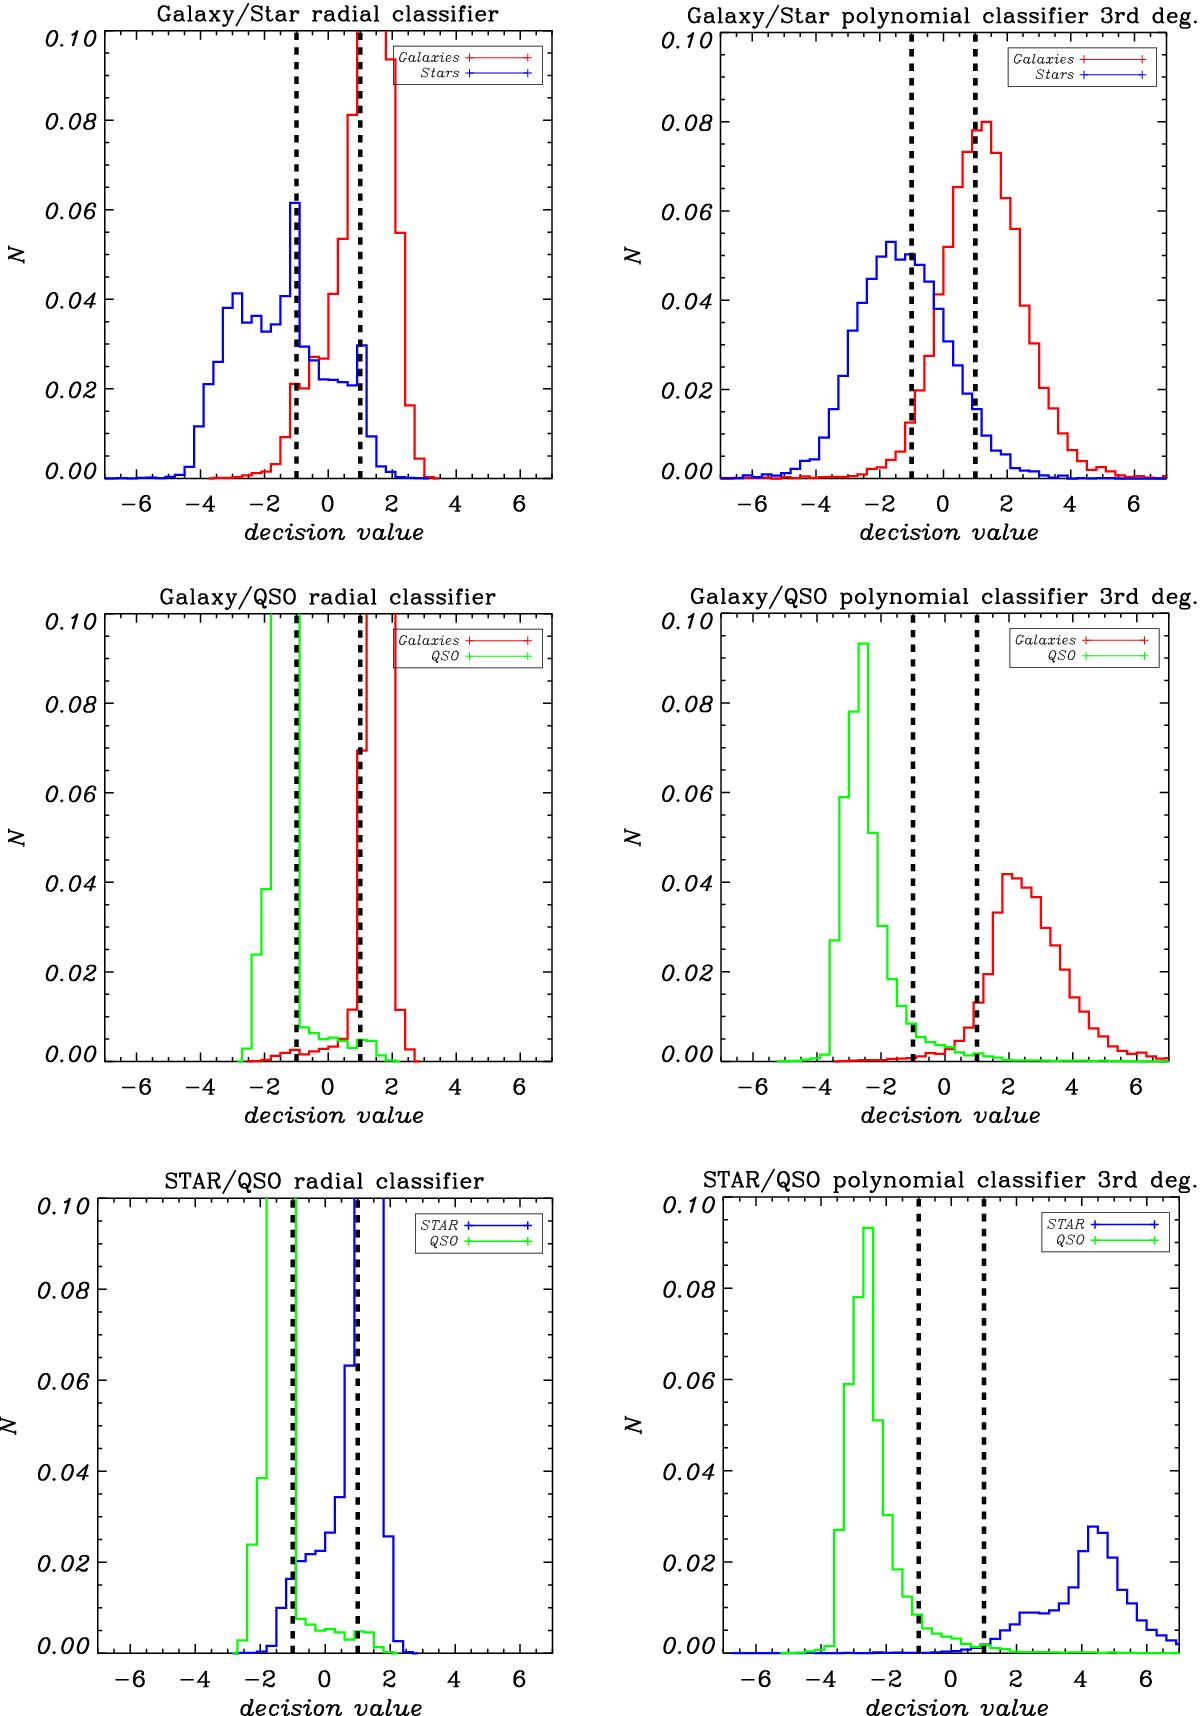
Comparison of the histograms of projection values of the training data samples onto the normal direction of the SVM decision boundary for a radial (left column) and polynomial kernel (right column). The top row represents the division between galaxies and stars (red and blue, respectively), the middle row between galaxies and quasars (red and green), the bottom row between stars and quasars. Vertical lines represent the boundaries of the decision hyperplane margins for the two classes (+1 and −1), and 0 marks the position of the hyperplane itself.
Current usage metrics show cumulative count of Article Views (full-text article views including HTML views, PDF and ePub downloads, according to the available data) and Abstracts Views on Vision4Press platform.
Data correspond to usage on the plateform after 2015. The current usage metrics is available 48-96 hours after online publication and is updated daily on week days.
Initial download of the metrics may take a while.