Fig. 3
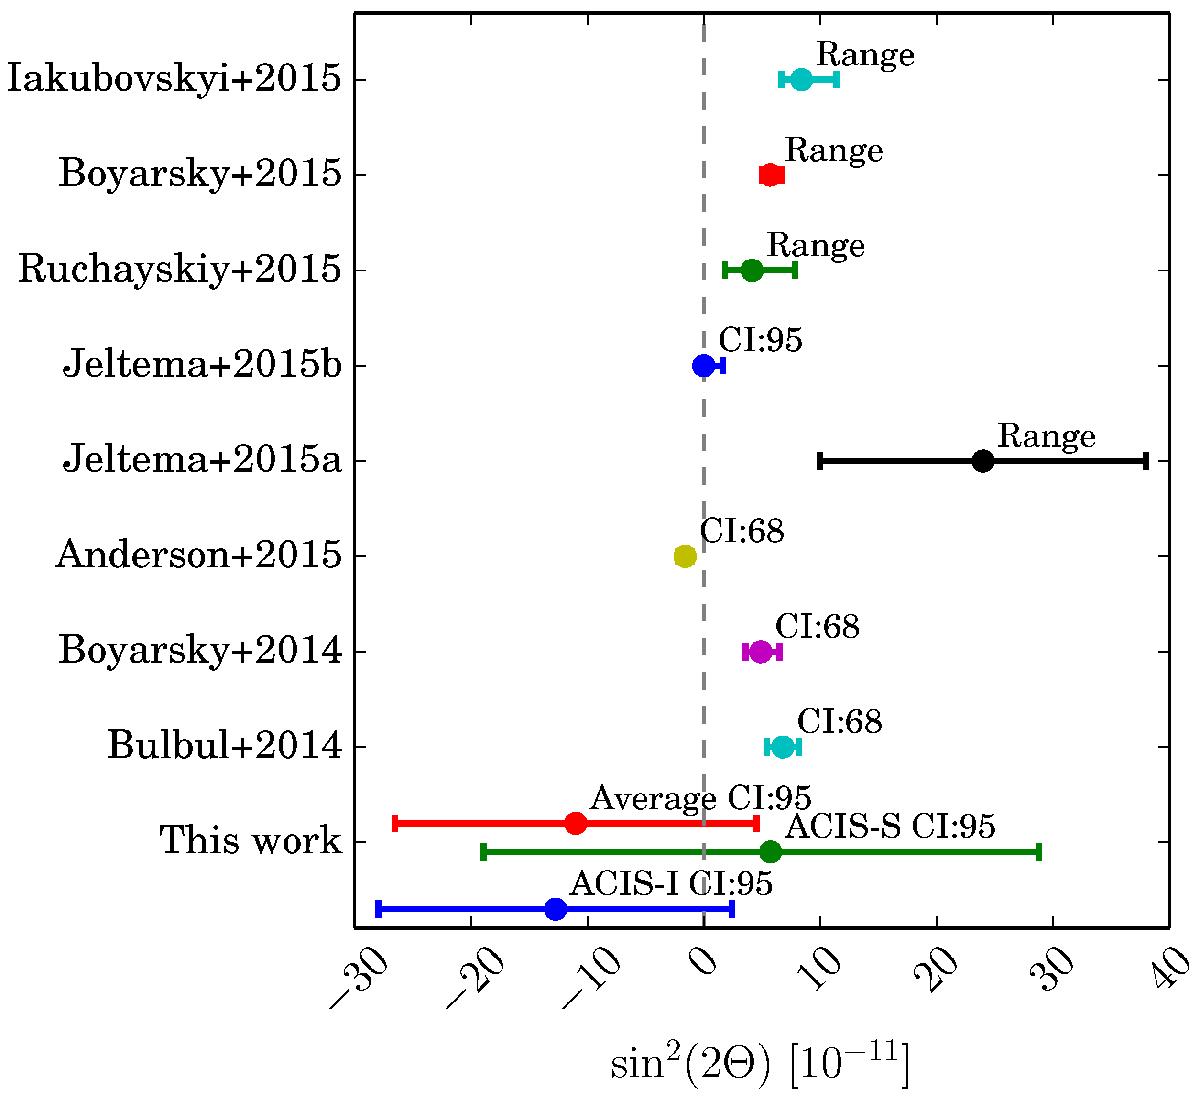
Comparison of this works constraints to selected literature values. The best-fit line energy varies between ~ 3.4−3.6 keV. This work: 95% confidence interval (CI) for Chandra ACIS-I (bottom) and ACIS-S (middle) stacked spectra and for the error-weighted average of all individual limits (top). Bulbul et al. (2014): 68% CI for the full cluster sample using the XMM-Newton MOS detectors. Boyarsky et al. (2014): 68% CI (statistical only) for the M 31 XMM-Newton data. Anderson et al. (2015): 68% CI for negative residual in stacked XMM-Newton data of galaxy halos. Jeltema+2015a (see Jeltema & Profumo 2015): range of values obtained for different mass models of the Galactic centre with XMM-Newton observations. Jeltema+2015b (see Jeltema & Profumo 2016): 95% CI upper limit from a deep observation of the Draco dwarf galaxy with XMM-Newton. Ruchayskiy et al. (2016): range of values obtained for different mass models of the Draco dwarf galaxy with the XMM-Newton PN instrument. Boyarsky et al. (2015): best-fit range for observations of the Galactic centre with the XMM-Newton MOS instrument. Iakubovskyi et al. (2015): range of best-fit values for a sample of galaxy clusters observed with XMM-Newton. Negative mixing angles are unphysical but result from Eq. (1) when allowing negative flux. The plot only shows selected constraints from the listed publications.
Current usage metrics show cumulative count of Article Views (full-text article views including HTML views, PDF and ePub downloads, according to the available data) and Abstracts Views on Vision4Press platform.
Data correspond to usage on the plateform after 2015. The current usage metrics is available 48-96 hours after online publication and is updated daily on week days.
Initial download of the metrics may take a while.