Fig. 2
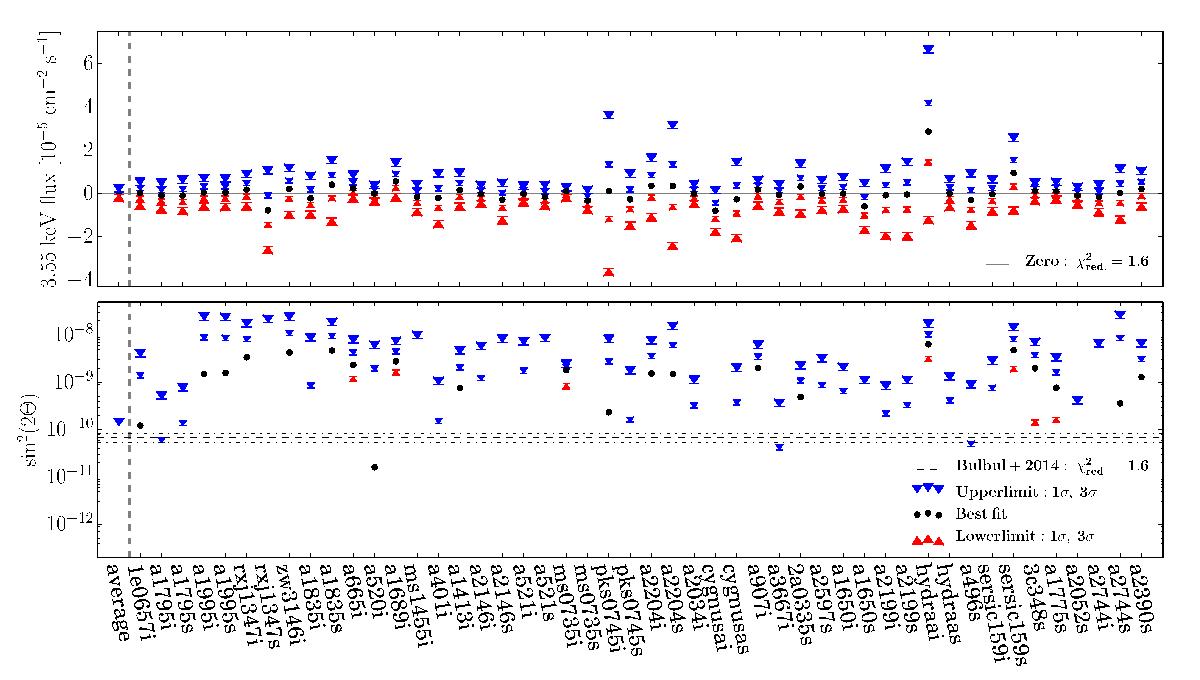
Top: limits on an additional Gaussian flux component at 3.55 keV for all clusters in the sample. Bottom: limits on the mixing angle in case of a 7.1 keV sterile neutrino. The limits are calculated separately for ACIS-S and ACIS-I, which are indicated by -s or -i following the cluster identification on the x-axis. Most lower limits and some best-fit values lie outside the plotted range. The dashed line shows the Bulbul et al. (2014) detection in their full XMM-Newton MOS sample. Limits show the 1σ (small symbols) and 3σ (big symbols) confidence range.
Current usage metrics show cumulative count of Article Views (full-text article views including HTML views, PDF and ePub downloads, according to the available data) and Abstracts Views on Vision4Press platform.
Data correspond to usage on the plateform after 2015. The current usage metrics is available 48-96 hours after online publication and is updated daily on week days.
Initial download of the metrics may take a while.