Fig. 1
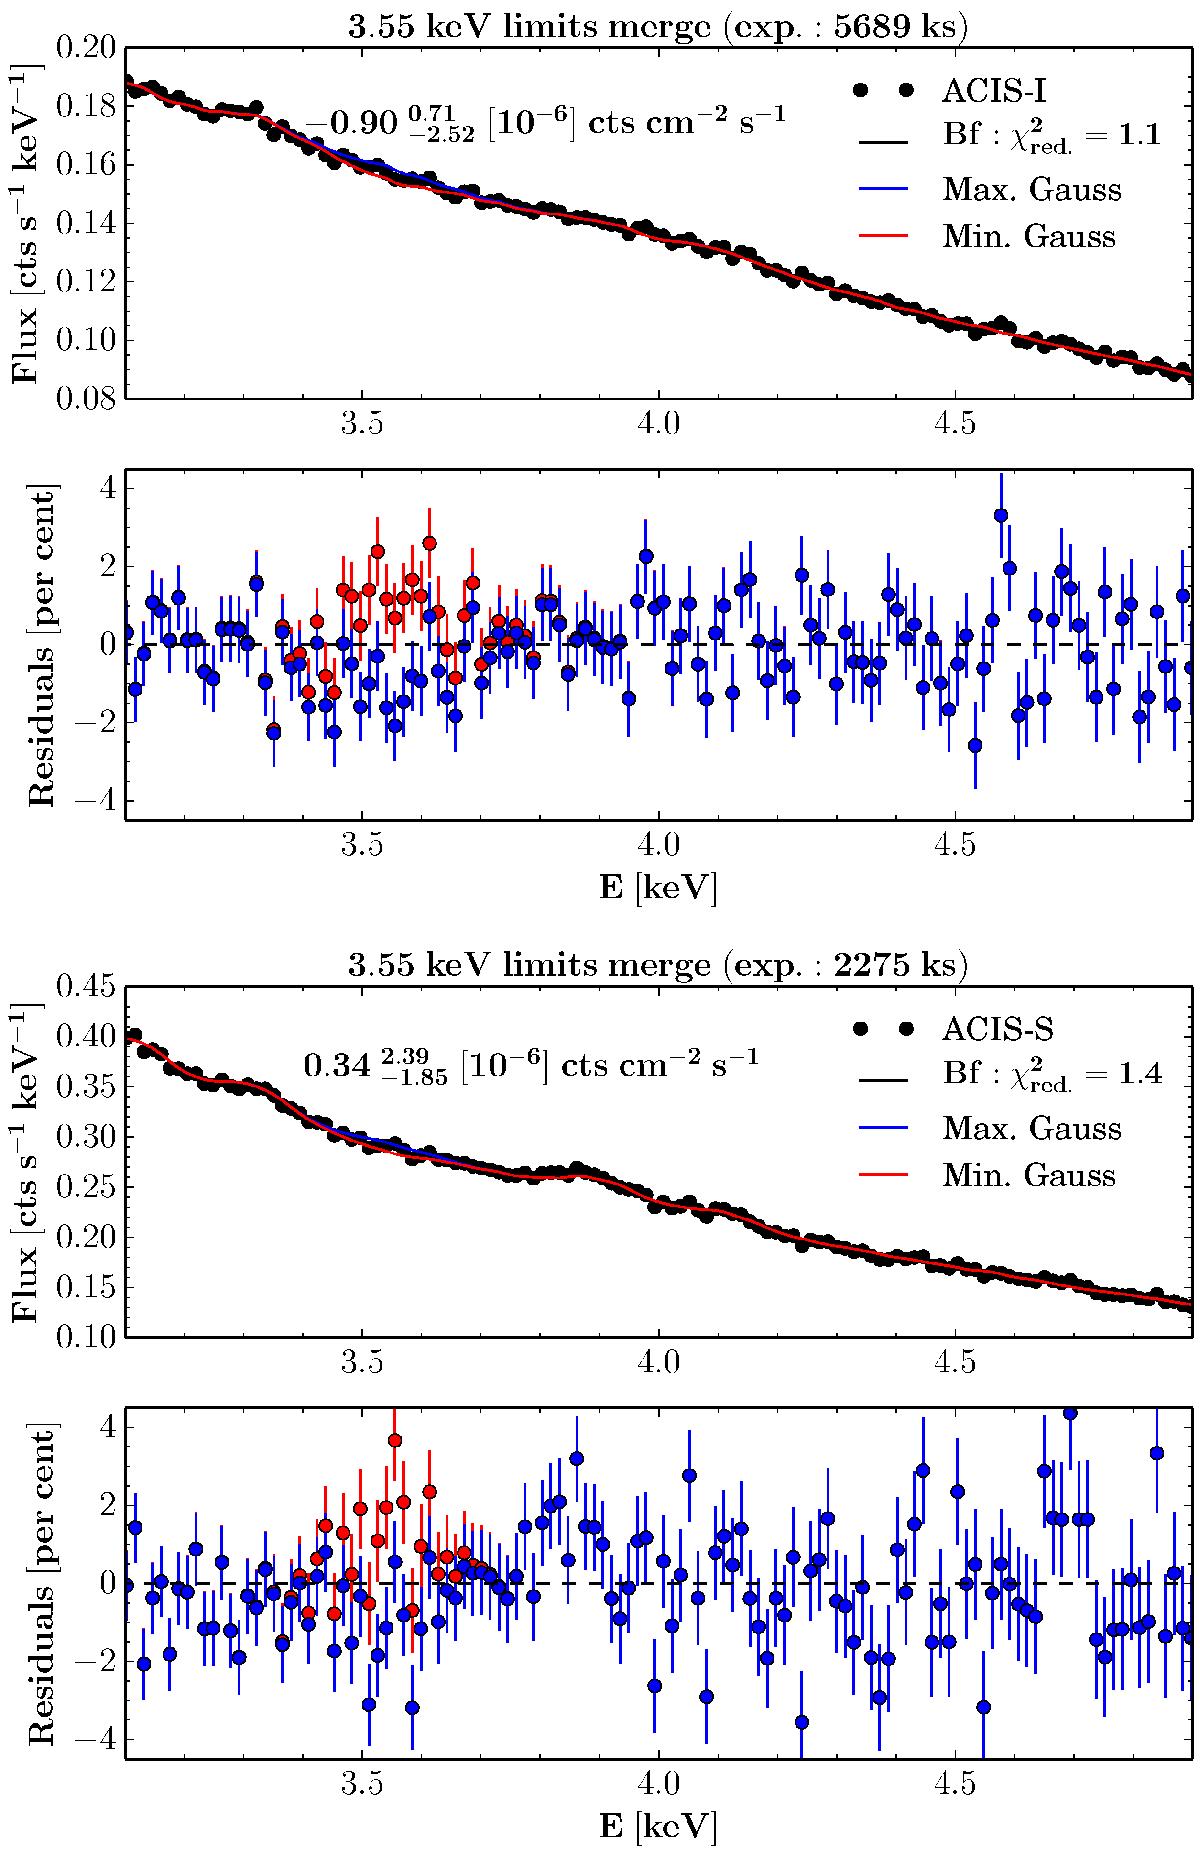
Merged X-ray spectra (ACIS-I top and ACIS-S bottom) of the cluster sample with residuals of different fitted models. Fitted XSPEC models: apec+apec+zgauss with best fit (Bf), upper and lower confidence values (99.7 per cent) of the Gaussian flux in counts cm-2 s-1. The annotations show the best-fit value and the confidence interval obtained using MCMC. Residuals are shown for the fit with upper (blue) and lower (red) confidence limit of the Gaussian flux. For the effective-area curve see Fig. B.1.
Current usage metrics show cumulative count of Article Views (full-text article views including HTML views, PDF and ePub downloads, according to the available data) and Abstracts Views on Vision4Press platform.
Data correspond to usage on the plateform after 2015. The current usage metrics is available 48-96 hours after online publication and is updated daily on week days.
Initial download of the metrics may take a while.